In addition to high-level Adoption metrics, replicated’s Builders Plan telemetry provides a number of tactical reporting views including customer reporting and instance telemetry.
Customer Overview and Instances Summary
The customer reporting view aggregates data from all instances deployed for a single customer license and helps you answer questions like:
- How long did it take to get this customer up and running?
- How many instances is this customer running?
- What (if any) are the differences in environment and app version across customer instances?
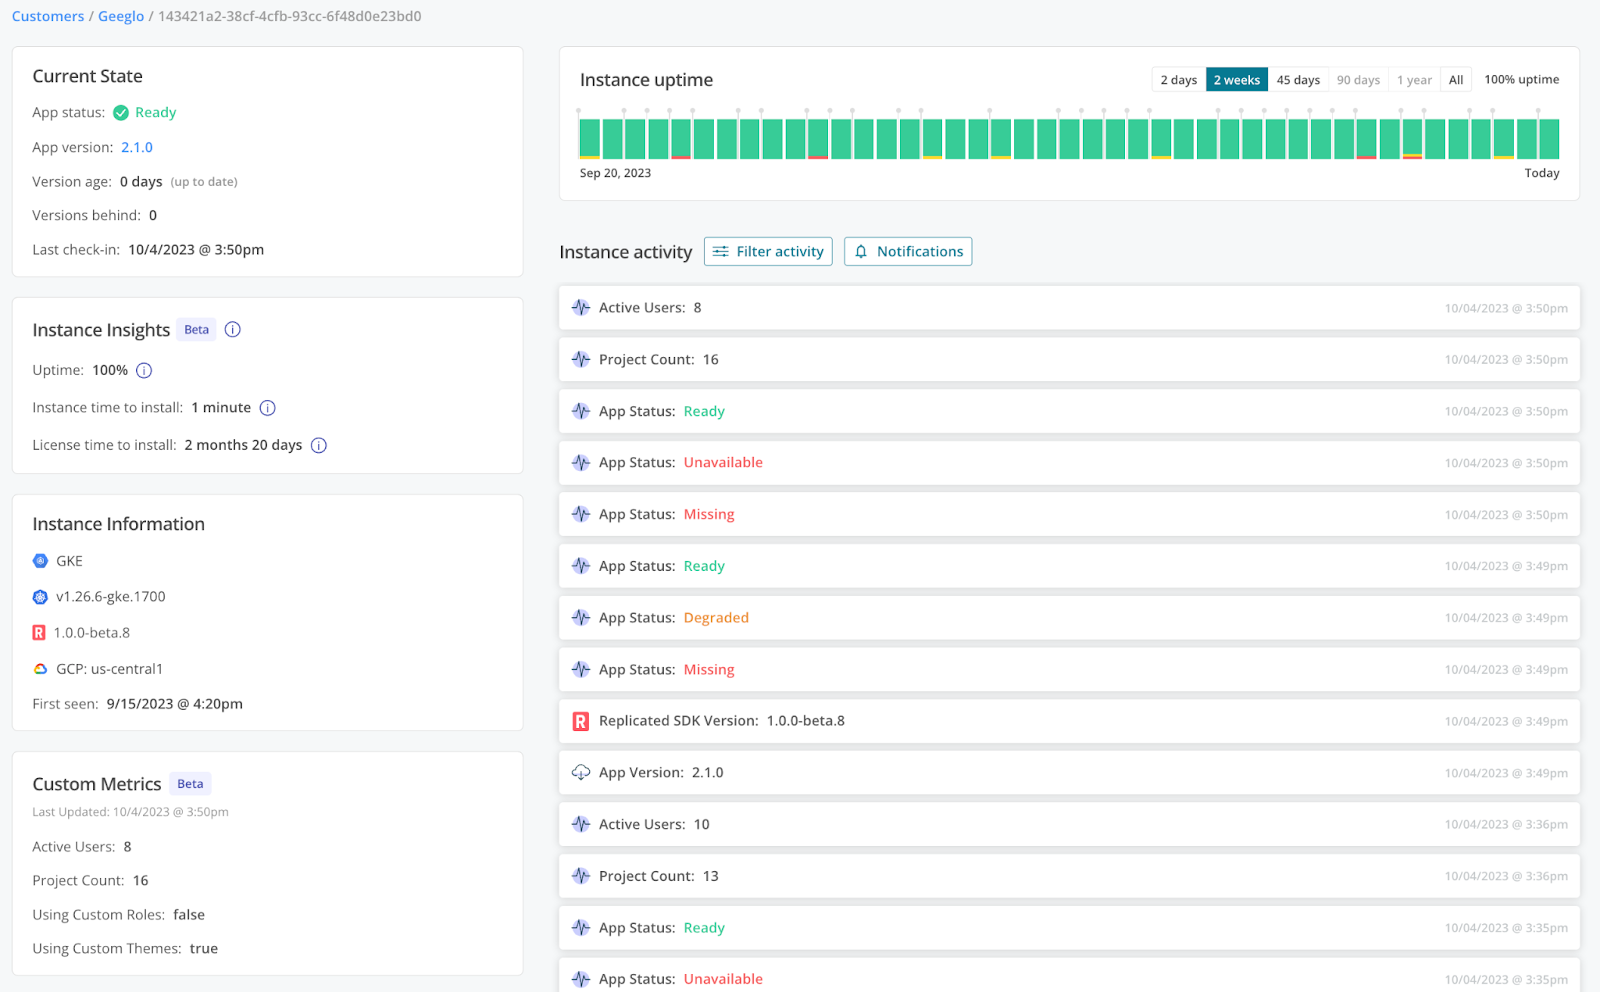
The Customer Overview shows both the count of active instances for a customer as well as two views of time to install - the time it takes to get a customer up and running with an instance of your software. These lay the groundwork for installation performance metrics across your entire customer base.
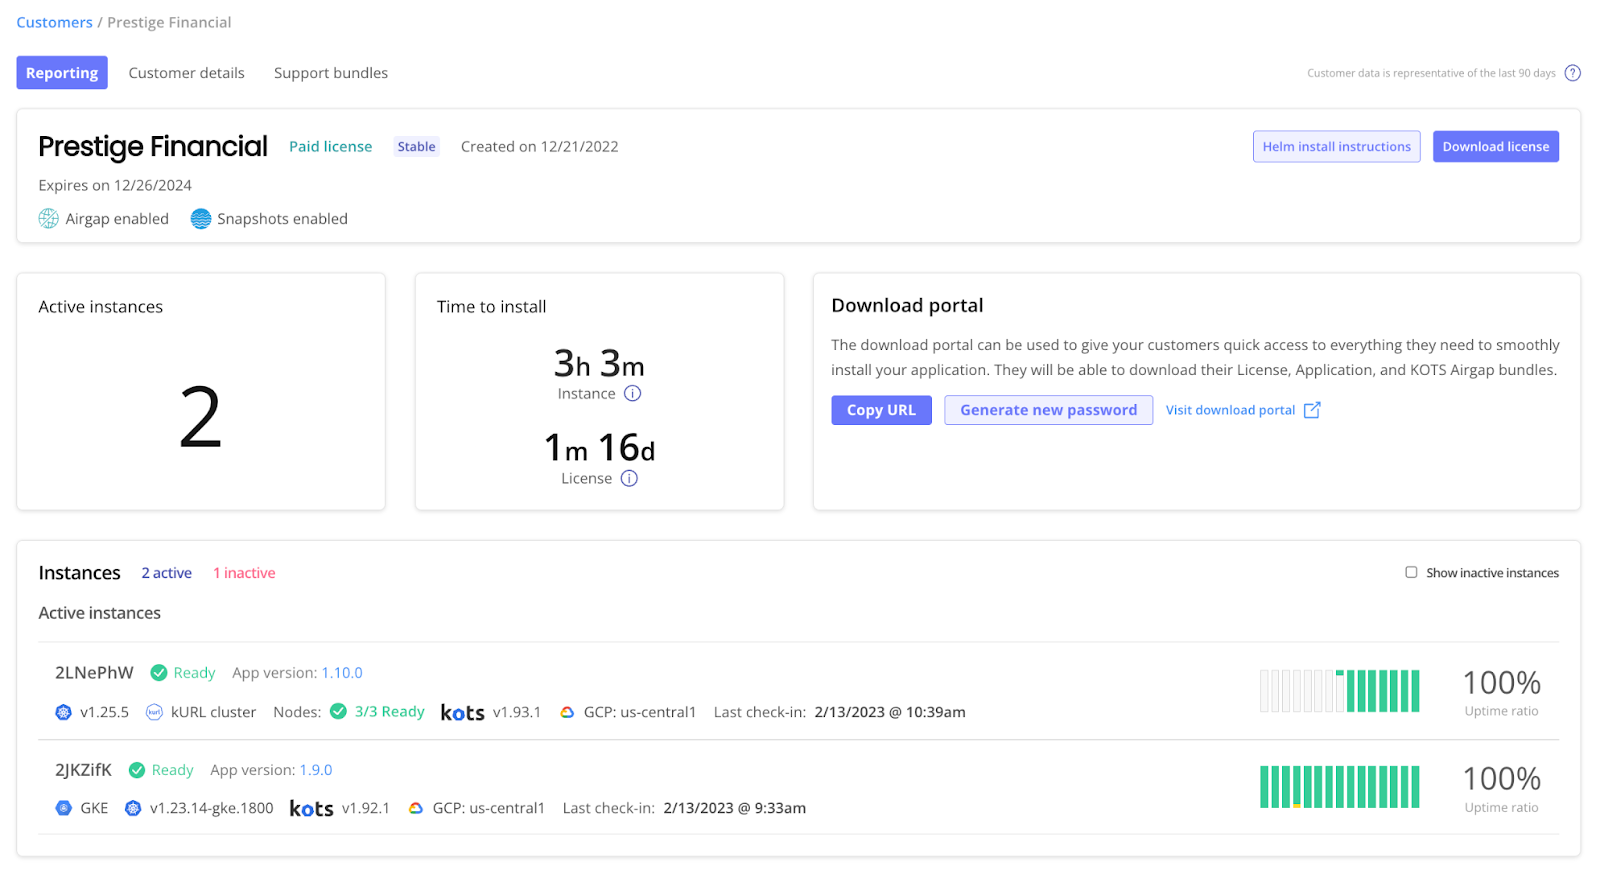
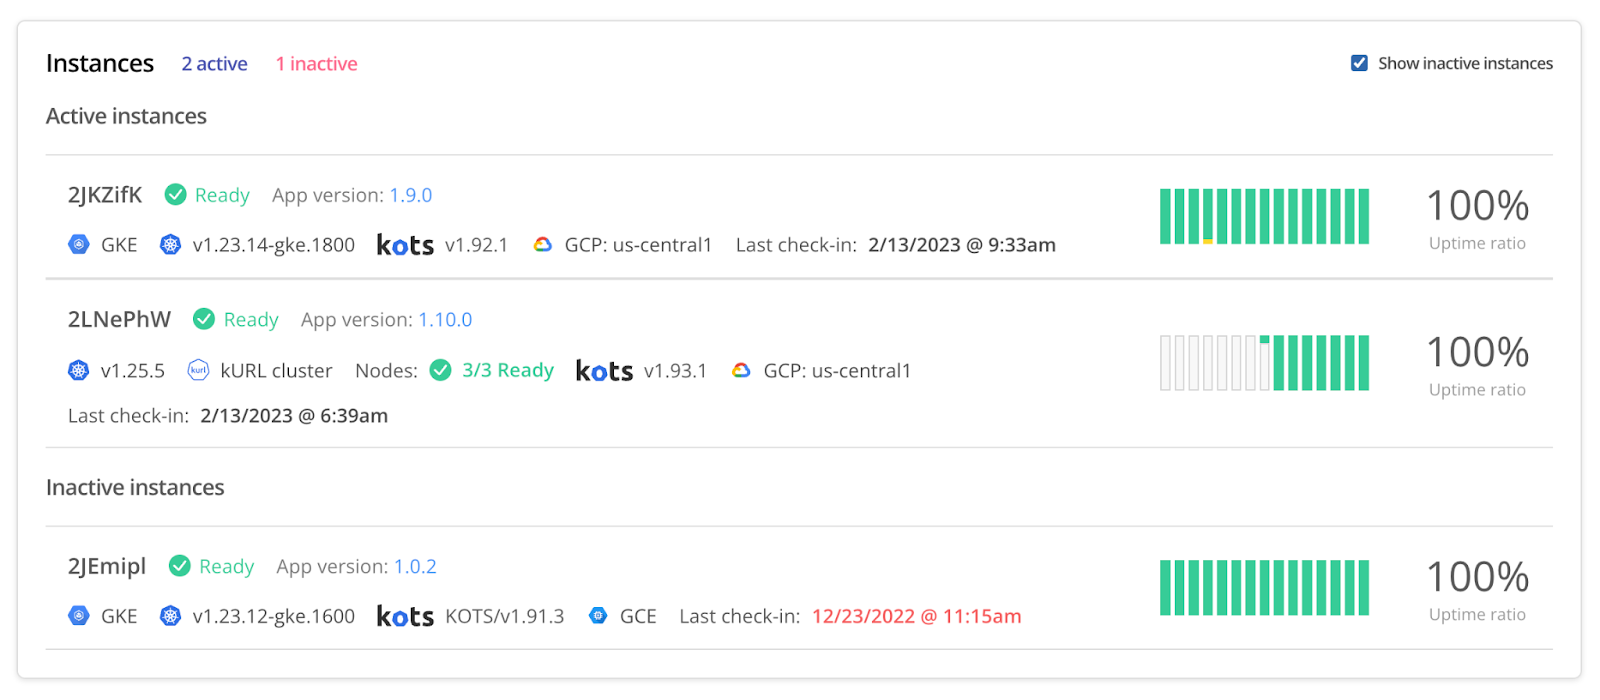
Instances Summary is a clear high-level preview of the deeper instance detail data and can be used for debugging instances and to give your team a better understanding of instance usage across a customer account for commercial/billing purposes. You can additionally give these instances their own “friendly” custom name along with other vendor-defined tags via the Vendor Portal UI, Vendor API or replicated CLI, making it easy to quickly identify instances. Vendor-defined instance name and other tags are included with any data export of instance data.

Uptime Data and Event History
Beyond context on customer usage and health, uptime data and event history help your team quickly and easily find out what has happened recently with an instance and and answer questions such as:
- Has the application experienced any downtime recently? How long has it been down?
- Have any cluster or infrastructure changes occurred recently? Have nodes been lost or added? Has the underlying Kubernetes version changed?
- Were any upgrades attempted recently? Which of them succeeded? Which version is the app currently running?
Uptime data is a time series representation of recent instance states, including ready, degraded, missing/unavailable, and inactive.

Event history is an ordered, filterable history of instance activity including changes to the cluster, application, and underlying infrastructure.
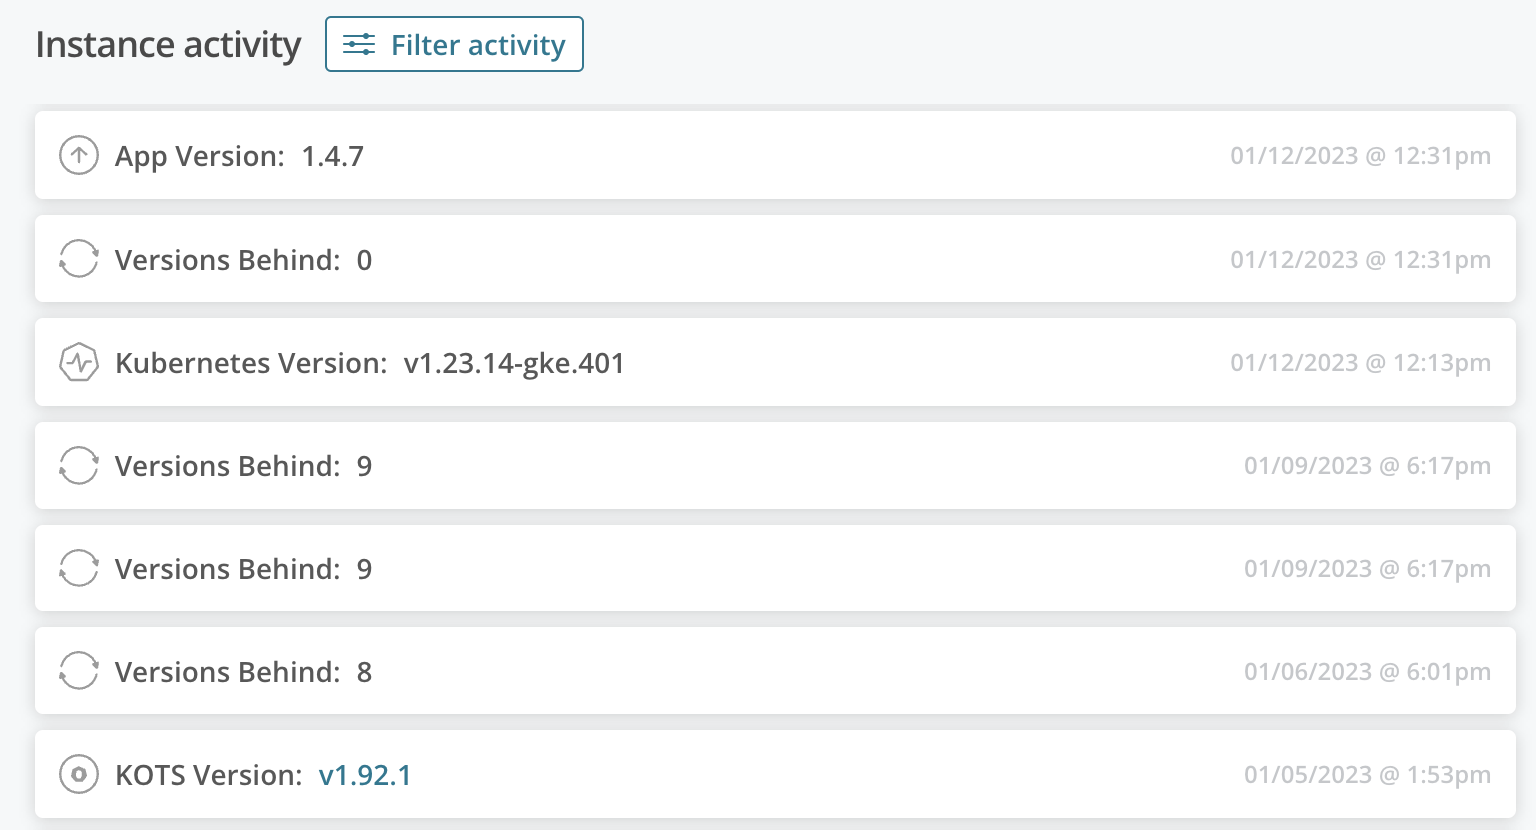
The customer instance telemetry and reporting details give deep context and save valuable time for vendor team members who are about to jump into a debugging session with an end customer. If used well, it will speed time to recovery for customer issues and even allow vendor teams to solve many problems asynchronously.
Custom Metrics
As we continued to develop advanced built-in reporting capabilities, one thing we heard frequently was the request for custom metrics that would help product, sales, support, and other teams better understand how their software was being used in customer environments. Primarily, teams wanted to detect and react to one or more of four cases:
- Decreasing or plateaued usage for a single customer: invest in success and the relationship to address a churn risk
- Increasing usage for a single customer: invest in growth, co-marketing, and upsell efforts
- Low feature usage or adoption: invest in usability, discoverability, documentation, education, and in-product onboarding
- High usage volume for a single customer: engage services and solutions engineering to help the customer scale their instance infrastructure to keep up with projected usage
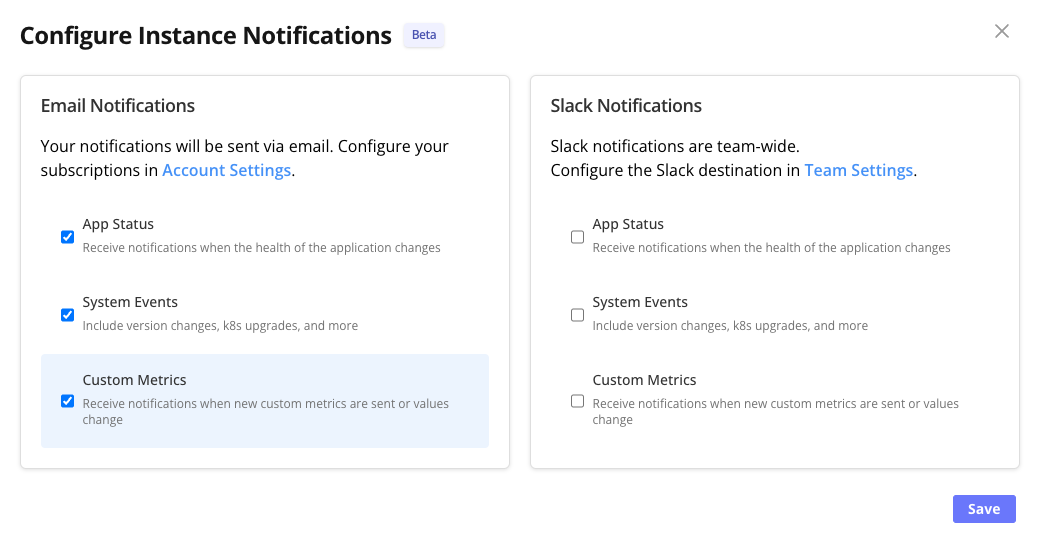
With the beta launch of Custom Metrics for Instance Insights, vendors can now send custom metrics to an embedded instance of the replicated SDK, and then view a 30d history of these metrics within Vendor Portal, or choose to export this data along with other instance data via replicated’s CSV Instances Export, JSON Instances Export, or Bulk Historical Event Export. Vendors leveraging our Instance Notifications feature can additionally be notified when new custom metrics are sent and/or metric values change.

What’s Next
While we continue to improve these features, we also have some exciting additions in the pipeline:
Air Gap Telemetry
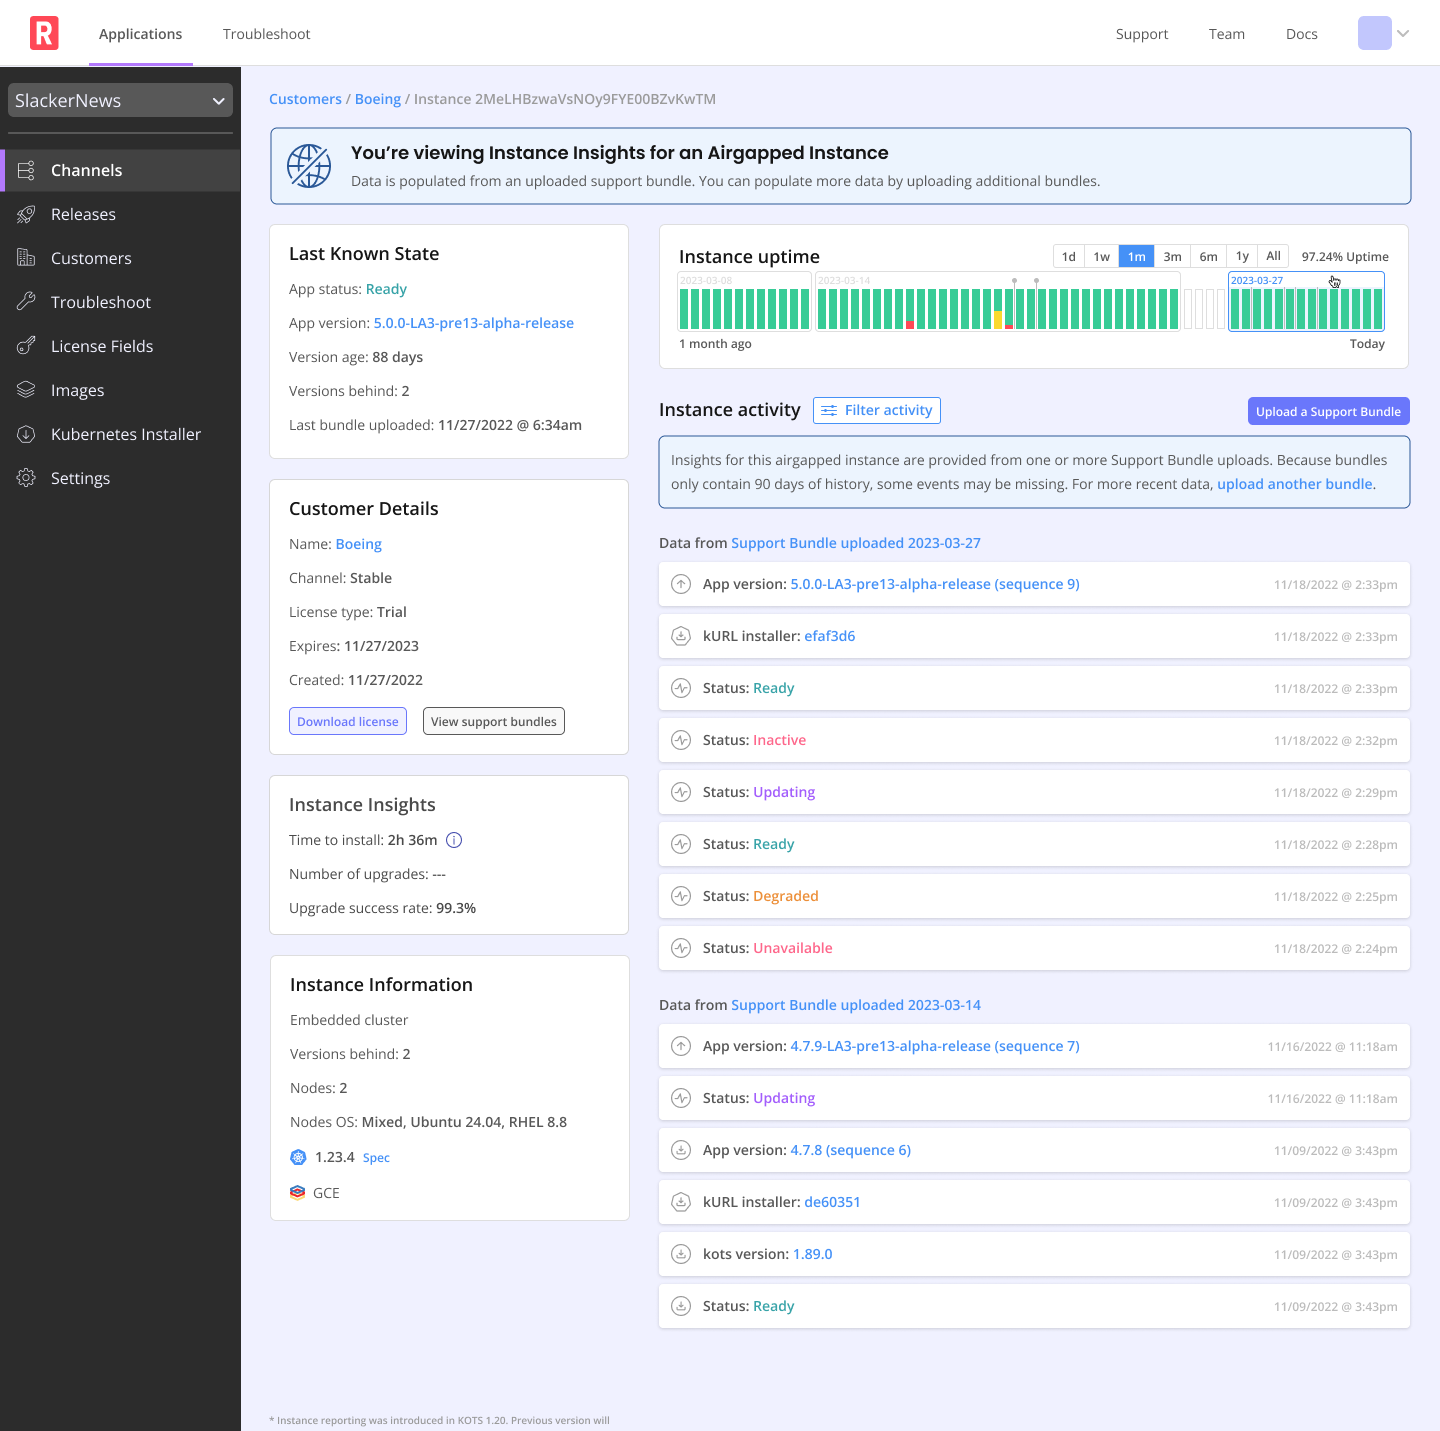
Recognizing the importance of air gapped customers, replicated is developing a suite of features that will enable your team to collect, inspect, aggregate, and analyze key data from your customers' air gapped instances.
Support bundles that are uploaded for any instance, including air gapped, will contribute event history to the core dataset used for the tactical insights across all your instances. This means that the same adoption, uptime, and other insights available for your online instances can now be collected and imported for airgapped instances.
Become an Early Adopter
Interested in becoming an early adopter of these upcoming features? We value your feedback and invite you to join us on this journey of continuous improvement. Reach out to let us know your thoughts, we’d love to hear from you!
Want to learn more about what replicated does to help vendors distribute software to self-hosted environments? We would love to show you -- click here to schedule a demo.