Measure What Matters

A unified platform bringing the visibility you need to speed up app installs, improve reliability, and delight customers.

Try for free
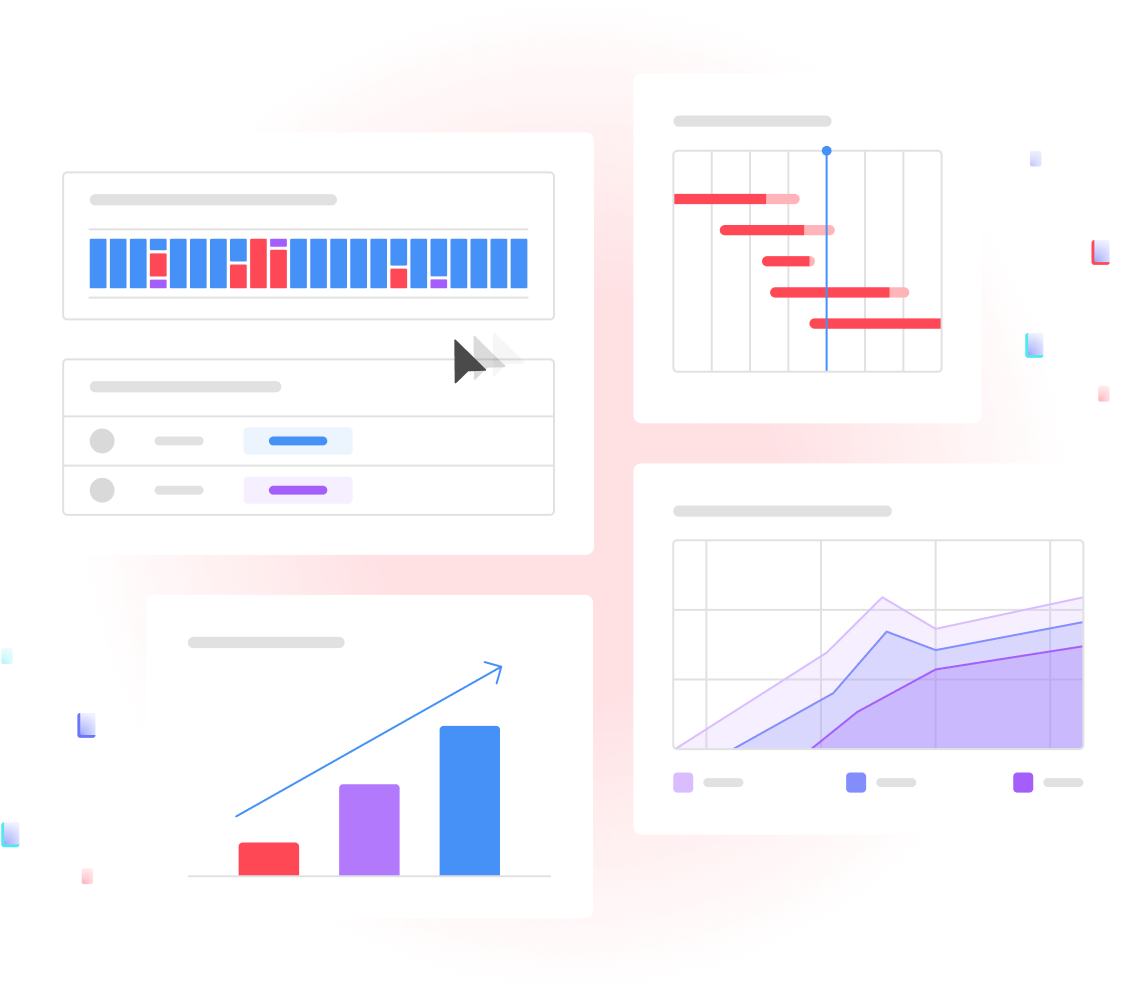
A summary image showing an uptime graph, installation progress bars, and adoption area graph of active instances on different versions and a bar graph trending upwards

replicated Value

replicated brings everything you need to efficiently handle the toughest requirements around delivering your app to your customers. Our platform is designed around the needs of your organization to help simplify complex tasks. Don’t try to build all these capabilities yourself! Instead reduce your effort and cost by going with a trusted solution.

How it Works

You can’t improve what you can’t measure. replicated helps you leverage insights about the health and performance of your application in customer environments to drive continuous improvement.

Improve installation times

1

Understand how long it takes to get your software up and running in the field

2

Track installation progress and success rates across  different customer environments

3

Identify bottlenecks, friction points, and areas for improvement

Several installation progress bars at different progressions
Area line chart showing the number of active instances on three different versions from January through April

Drive adoption of new releases

1

Align teams around value delivery and a great upgrade experience by measuring new version adoption

2

Reduce the overhead of maintaining support and documentation of older versions

3

Understand effectiveness of communication and marketing of releases

Enhance reliability

1

Understand the health and performance of your software in customer environments

2

Cultivate proactive awareness of customer instance issues to minimize incident impact

3

Resolve problems faster with the status and history of customer instances at your fingertips

Uptime chart showing instance activity with active, degraded, and inactive statuses
A variety of simple charts and graphs

Sell faster and reduce churn

1

Gain visibility into active or pending churn indicators with instance status reporting

2

Understand your trial or POC conversion timeline and identify at-risk evaluations

3

Explore how installation and adoption metrics drive business indicators like churn and close rate

How it helps

Business benefits

  • Accelerate delivery of new features and product value

  • Identify and reduce churn

  • Accelerate proof-of-concept and time-to-value

  • Reduce downtime and support burden in customer environments

Technical benefits

  • Use information about customer environments to make better product and engineering decisions

  • Drive empowered teams aligned to data-driven, measurable goals

  • Improve application stability

  • Solve customer problems faster

Measurable impact

Measure and track your performance of key metrics to understand and improve the delivery and distribution of your application(s) to customers. View data on adoption rate, time to install, uptime, upgrade success rate, and more to make data-driven improvements and drive value increase. Teams that measure these operational metrics have a better chance at improving them.

In terms of time to value, if you deliver a feature that takes three months for you to get to your on-prem customer, that’s three months of that feature not getting any value for your customers. That return on investment is massive.

BARRY GLEESON  | PRODUCT MANAGER
SmartBear logo

Explore the replicated Platform

See how replicated supports every piece of the Software Distribution Lifecycle.

Ready to get started?

Explore the product further, or create an account now and start exploring in a Free Trial. You can also contact us if you'd like a demo or to discuss one of our pricing plans.