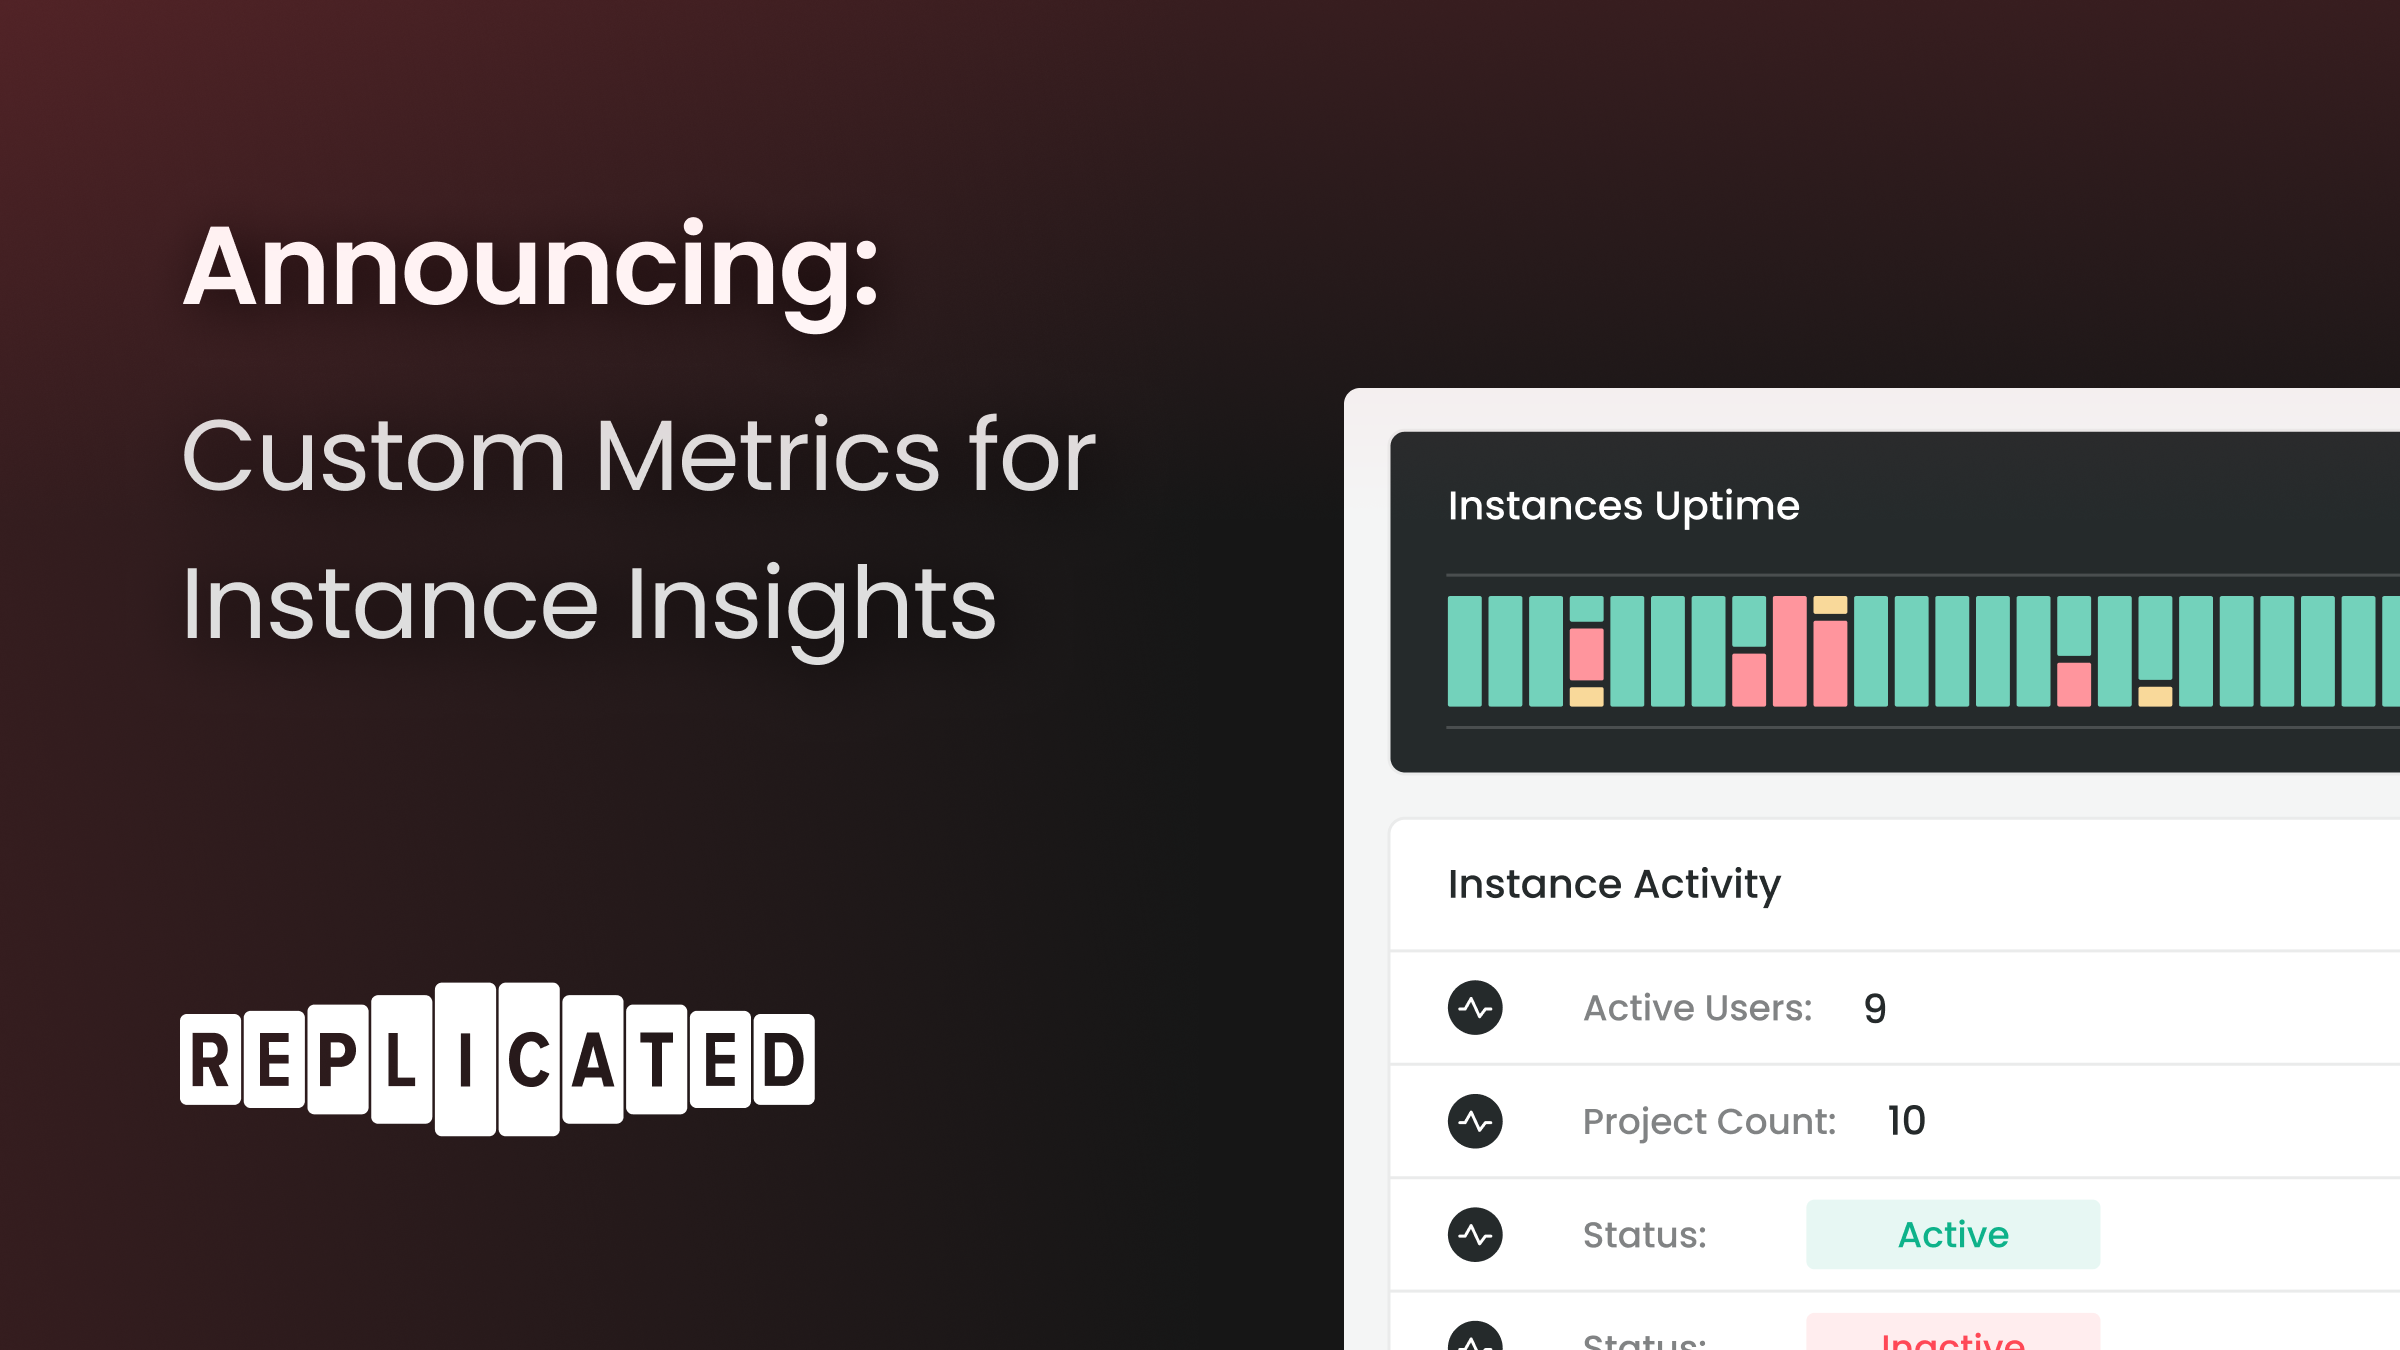
In the past few months, replicated has advanced the state of the art in telemetry features for observability of app instances in customer-managed (non-SaaS) environments. We’ve delivered tactical troubleshooting views, strategic adoption reports, and experimental support for air gapped telemetry. Now we’re announcing a new way to use Instance Insights: Custom Metrics. Beyond just instance uptime, app versions, and infrastructure status, vendors can now measure *anything they want* about customer instances. This means
- Product teams can understand usage and adoption of features
- Sales and customer success can understand usage volume to identify growth opportunities and churn risks
- Engineering and support teams can work with customers to meet scaling needs proactively as usage grows

With Custom Metrics, software vendors can get visibility into customer usage, and move closer to realizing this key benefit normally reserved for SaaS applications, while still delivering securely into customer environments.
Why we built Custom Metrics
We’ve had positive feedback on the instance insights like the Customer Reporting, Instance Detail, and Adoption Reporting, but one common ask was to integrate custom reporting. Since replicated is already making a regular outbound request from the customer's online-connected environment for update checks and operational telemetry, vendors wanted to attach a small amount of custom usage data to that request as well. In SaaS instances, vendors can immediately see customer usage and use this info to respond to different trends, and they wanted this same level of detail for non-SaaS deployments, including:
- Decreasing or plateaued usage for a single customer: invest in success and the relationship to address a churn risk
- Increasing usage for a single customer: invest in growth, co-marketing, and upsell efforts
- Low feature usage or adoption: invest in usability, discoverability, documentation, education, and in-product onboarding
- High usage volume for a single customer: engage services and solutions engineering to help the customer scale their instance infrastructure to keep up with projected usage
We also found that many software vendors wanted to consume this information from one of many different places:
- Directly in the replicated vendor portal
- In a CRM system like Salesforce or Gainsight
- In a Data warehouse like Redshift, Snowflake, or BigQuery
- In a BI tool like Looker, Tableau, or PowerBI
Now vendors have the option to review data in the Vendor Portal, or export it via APIs or CSVs into any other system. In making this usage data available for your customer-hosted instances, we enable you to make better decisions about where to focus your efforts across product, sales, engineering, and customer success.
How custom reporting works
In working with multiple vendors, we’ve found that they almost always want to send metrics that are an aggregation over data stored in a SQL database running in the customer environment. With this in mind, we’ve designed this feature so that vendors can assemble whatever metrics payload they want and send it to an in-cluster API. This info can be periodically sent by either 1) their core application code or 2) a purpose-built component.
Sending Metrics
To start, set up your app to send a metric payload on regular intervals to an Endpoint in the replicated SDK. Currently only JSON scalar values (number, string, boolean) are supported.
Below is a code example for a simple Node.js app that sends metrics on a daily interval:
Viewing custom metrics
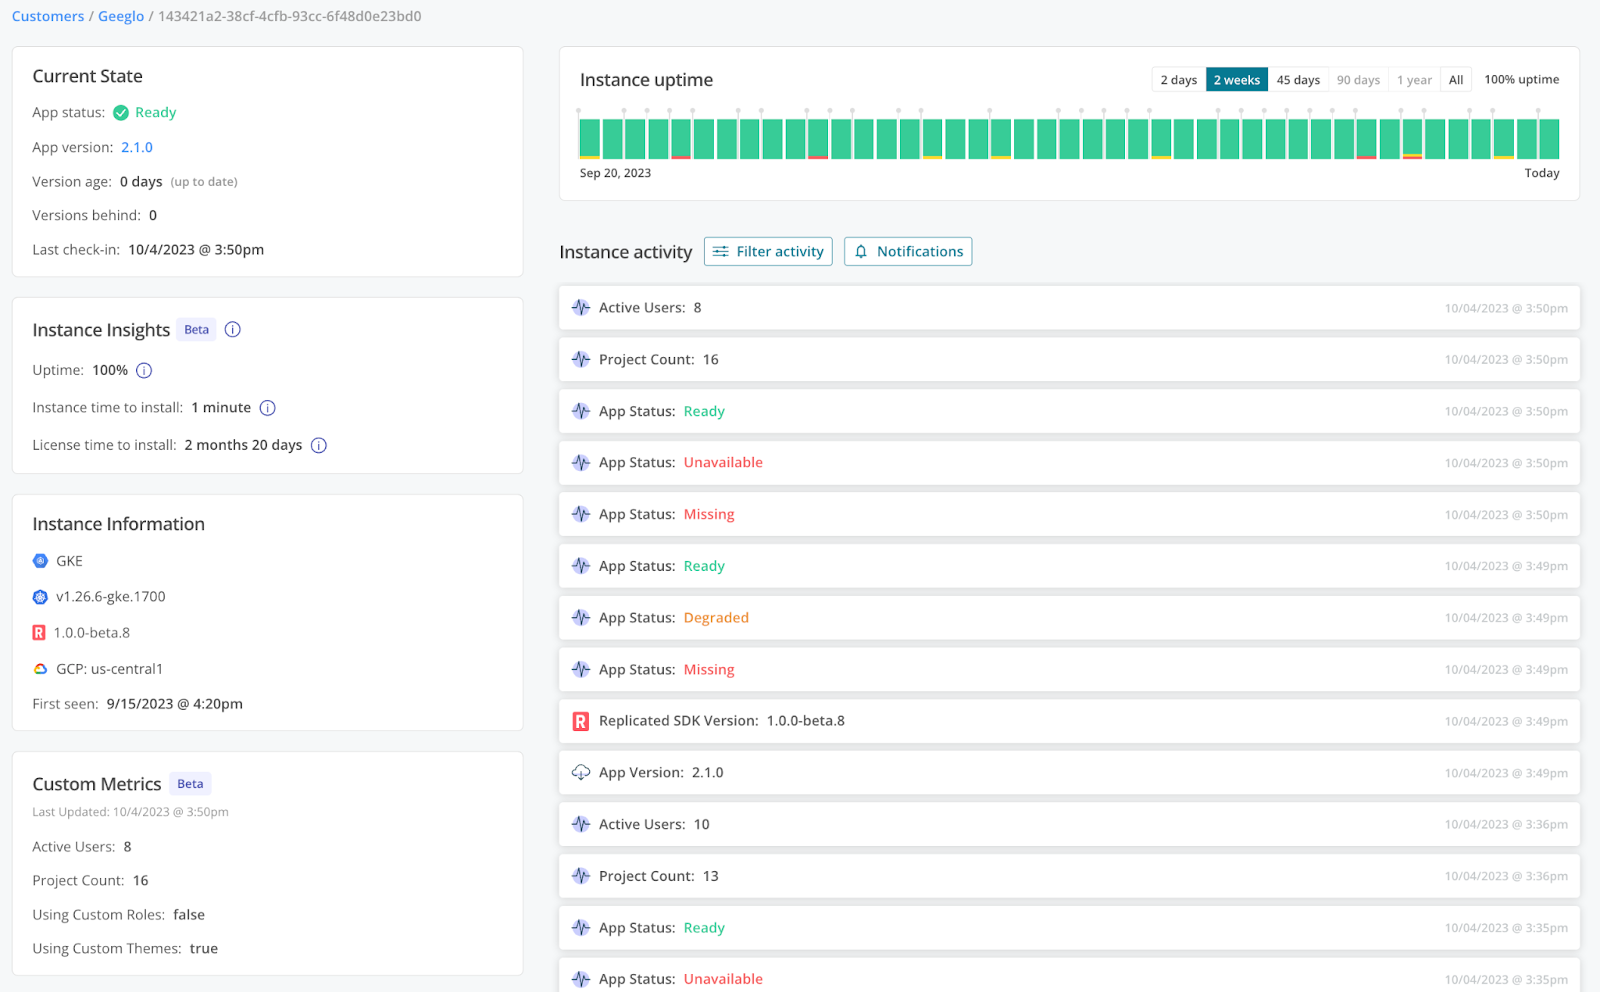
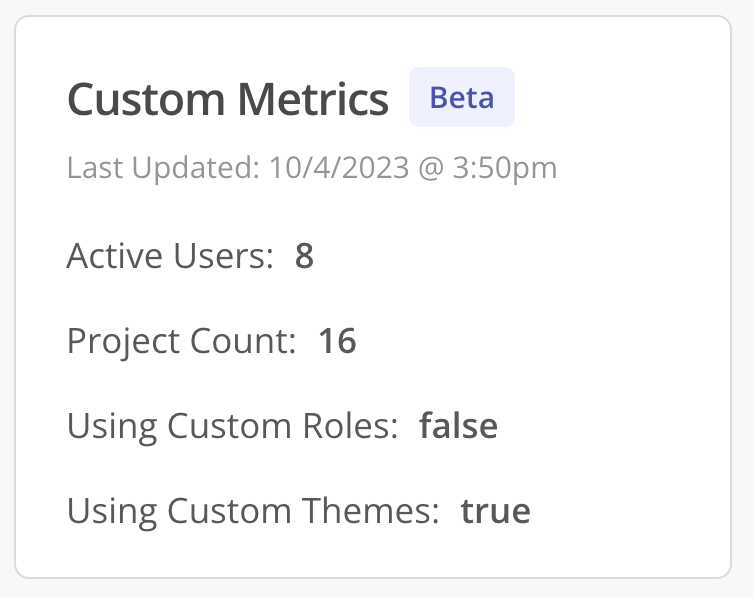
The current state and event history are displayed in the instance detail page.

Events will be generated in the stream whenever a custom metric value changes.

These same values can also be queried from the replicated Instances API:
These values will also be included in the new instances CSV download with a custom_metric__ prefix


Note: Some columns in the above CSV view have been hidden for clarity.
Generating and visualizing custom time series data
It’s often important to be able to analyze time series data for custom values as they change. This allows vendors to understand if usage is increasing or decreasing, which is key to identifying if a customer account needs attention. While we don’t (yet) have custom graphing or reporting for these values in the Vendor Portal, we would like to enable data export so that you can understand how usage is changing over time. The above outlined CSV and JSON APIs can be used to ascertain the state of an instance in time, but other history and event APIs will be needed to show time series data. The existing /instance/:instanceId/events can be used to fetch event data for a single instance, including events from custom metrics.
Next Steps
Head on over to Custom Metrics on our Docs site for a deep dive and overview of limitations.
While API and CSV export is available today, we’ll look to continue improving the integration points that enable you to move this data into the systems where you need it. We’re also actively developing functionality for enabling telemetry collection from air-gapped environments, and will aim to include Custom Metric support in that work. If you’d like to be an alpha tester for air-gapped telemetry, let us know.
If you’re going to add to the metrics that you send from your customer-managed application, we recommend notifying your customers, either directly or via a public web page that documents what data you collect. See the SlackerNews telemetry documentation for an example of doing this well.
We’re looking for feedback on this functionality. If you’d like to be a design partner, please schedule time with a Product Manager or log a feature request.
Want to learn more about what replicated does to help vendors distribute software to self-hosted environments? We would love to show you -- click here to schedule a demo.