Hello! My name is Star and I'm a Senior Software Engineer at replicated. I'm going to cover replicated's new custom metrics feature and how custom metrics can be used to measure various aspects of your customer's instances as well as how to configure and send custom metrics for your application.
Custom metrics are useful because they can be used by product teams to understand product usage and feature adoption. They can also be used by sales and customer success teams to identify growth or churn risks, or by engineering teams and support teams to be more informed about their customer's environment.
To view custom metrics, you can either view them natively through the vendor portal, or export them via our customers and instances CSV export to your preferred external monitoring system.
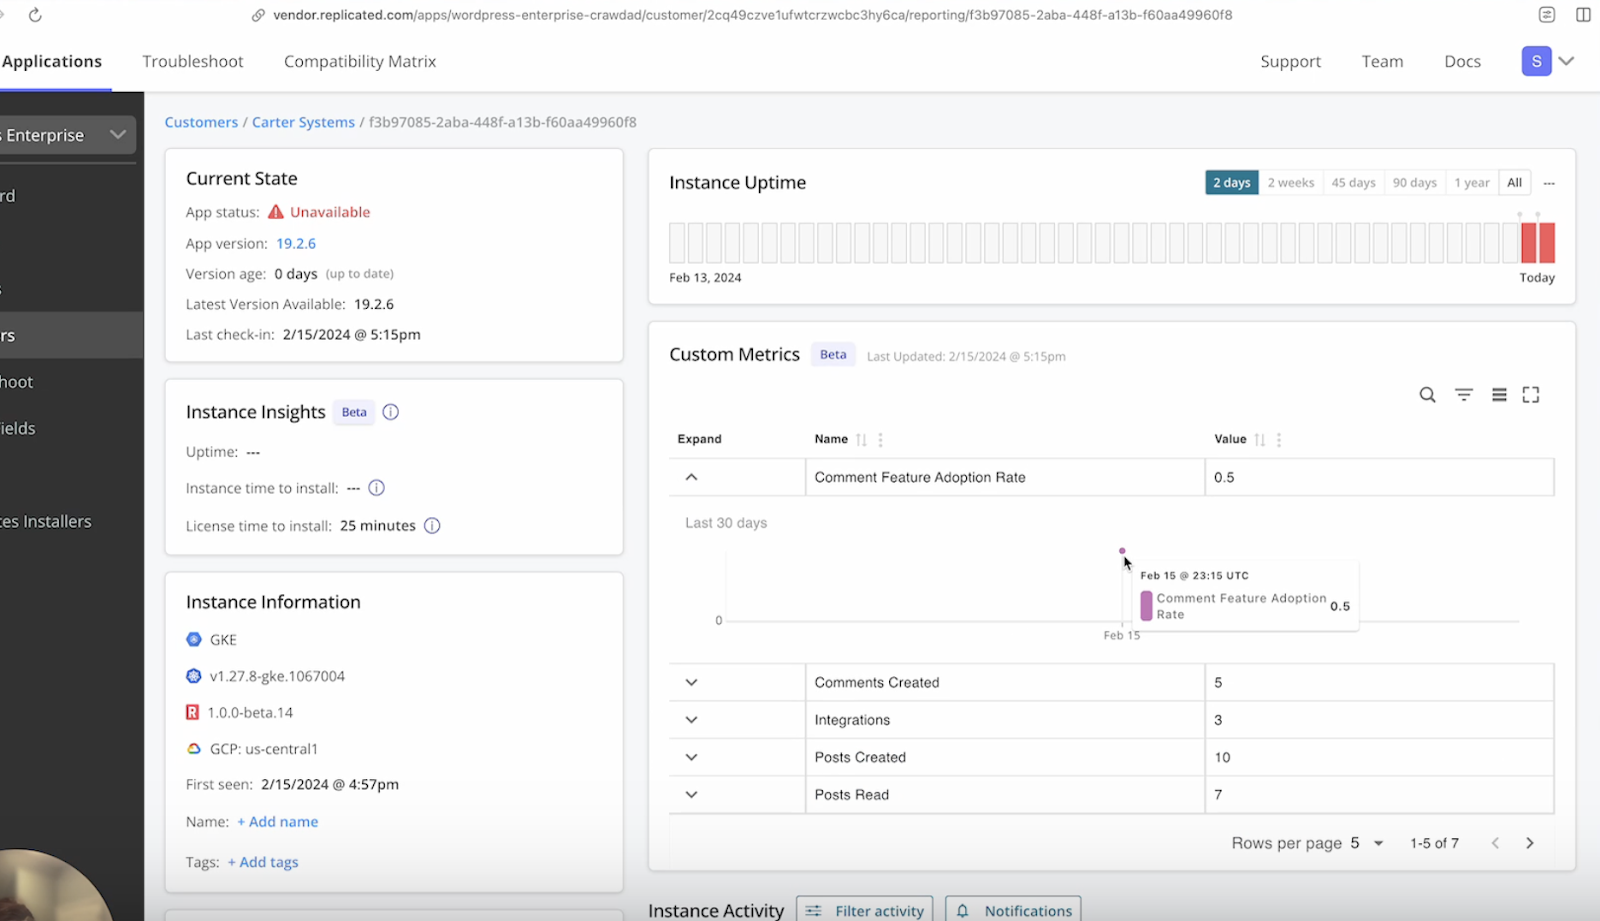
If you're in the vendor portal and looking at an instance on the instance details page, you can find your custom metrics here (on the “customers” tab).
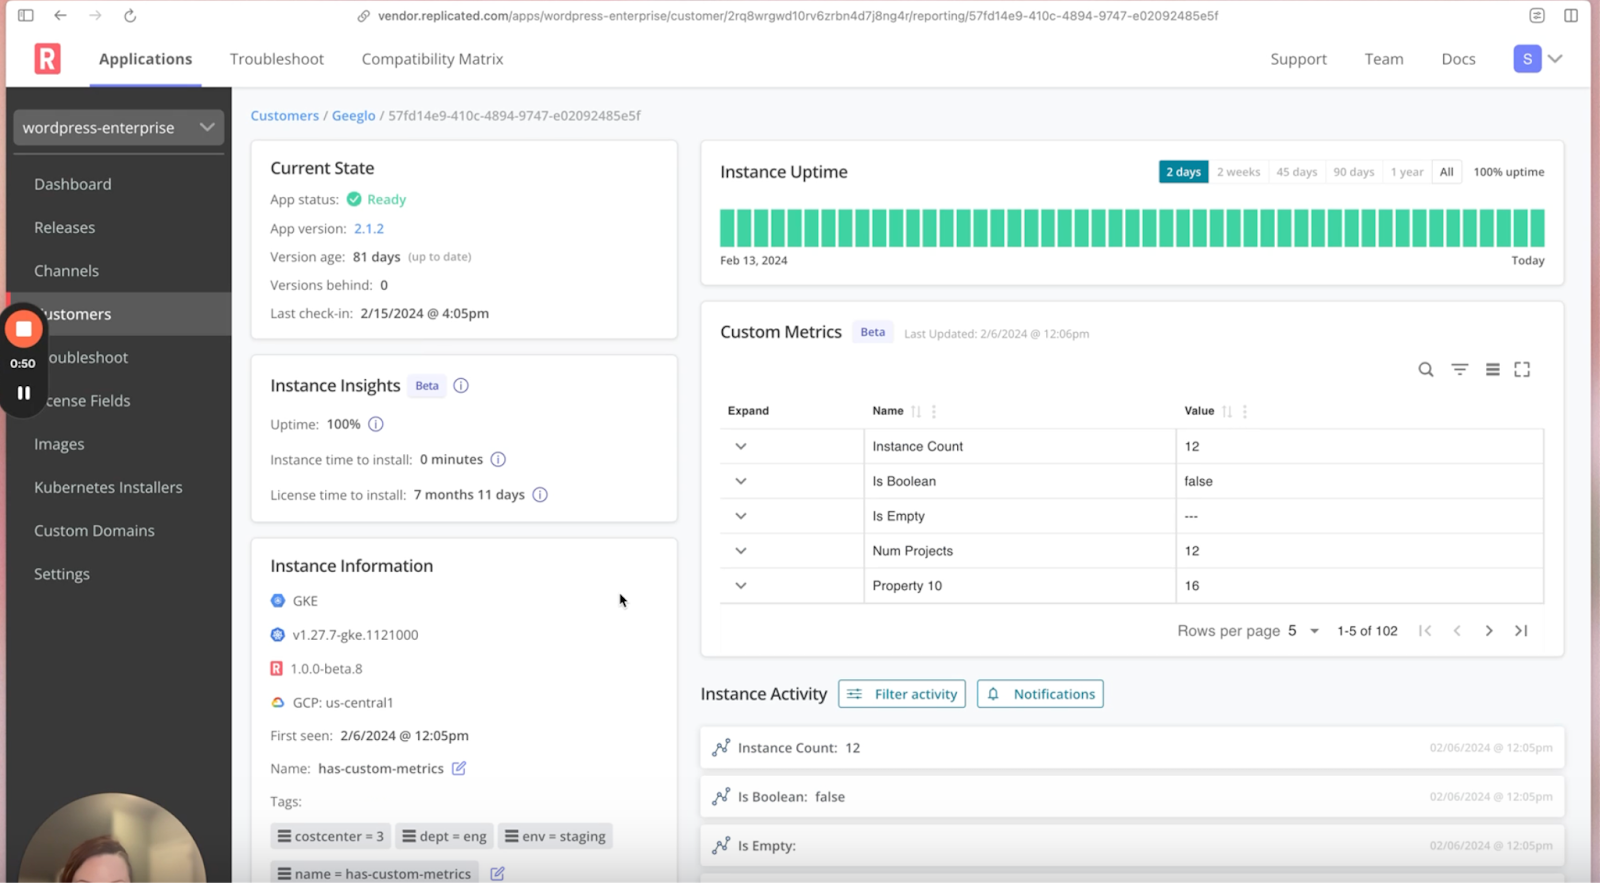
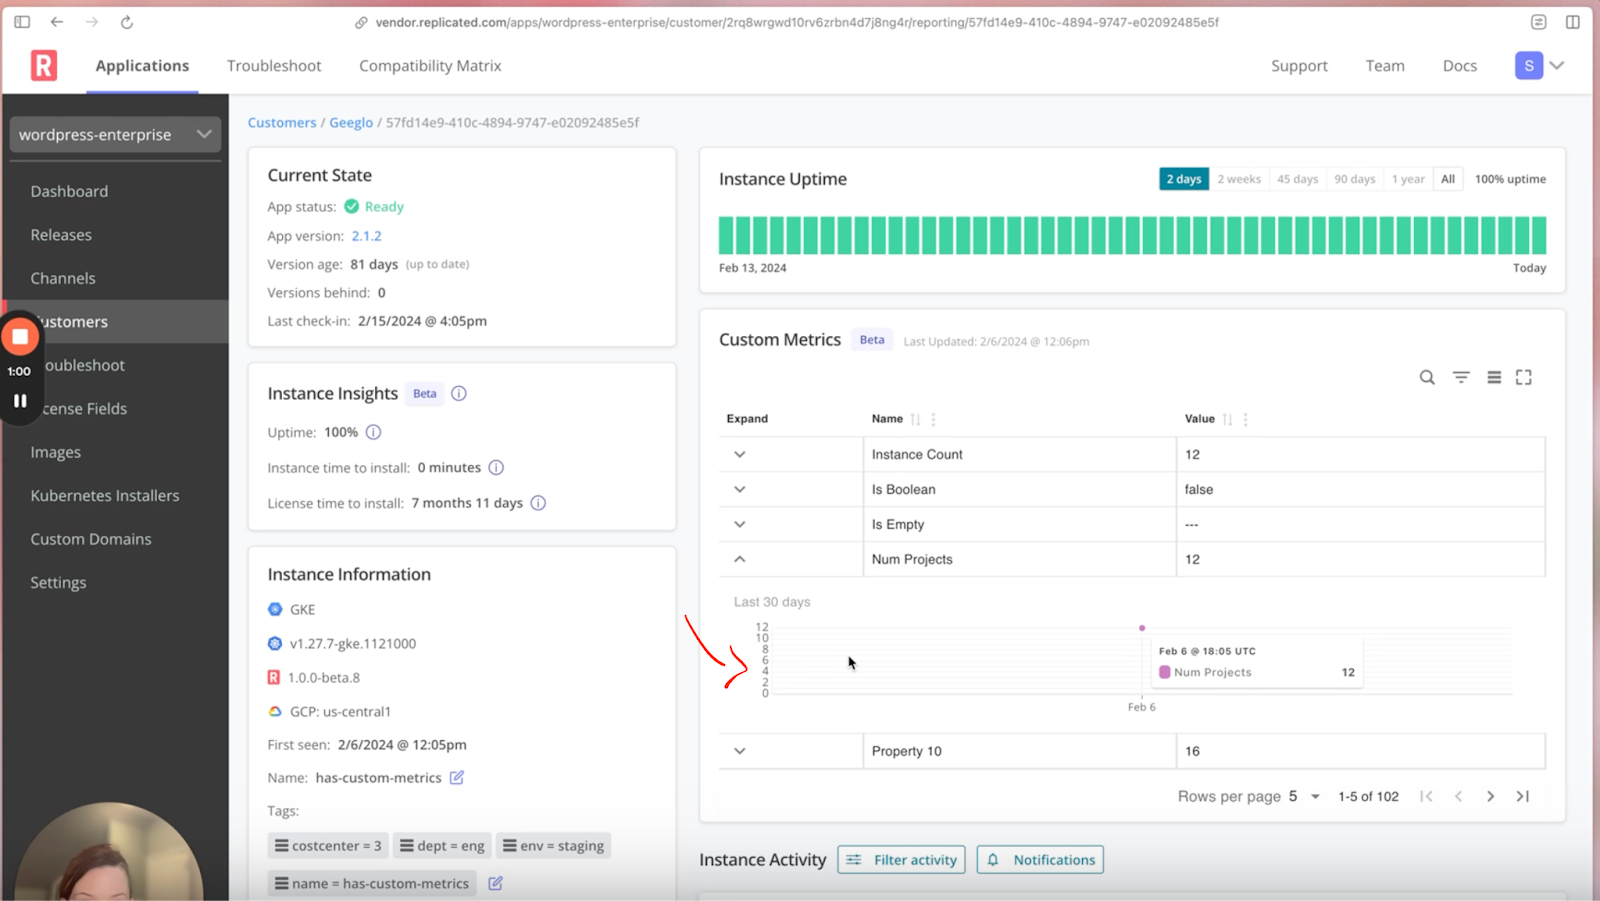
If you expand any of these panels, you can also find historical custom metrics data for any numerical instance metric.
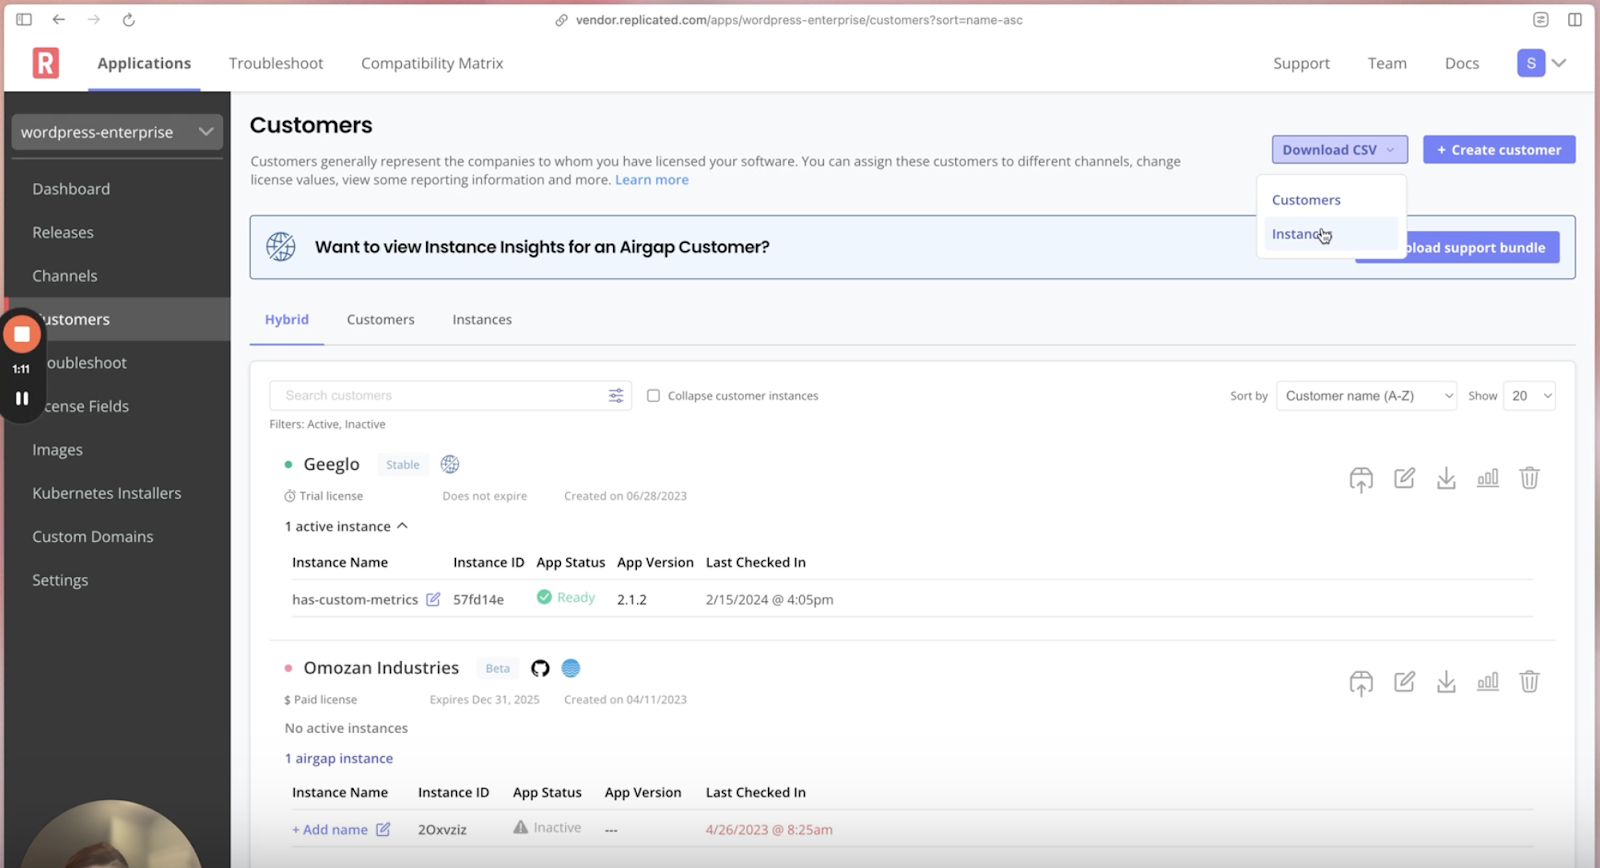
On the customers page here, where you download the CSV, is where you will find your custom metrics as well.
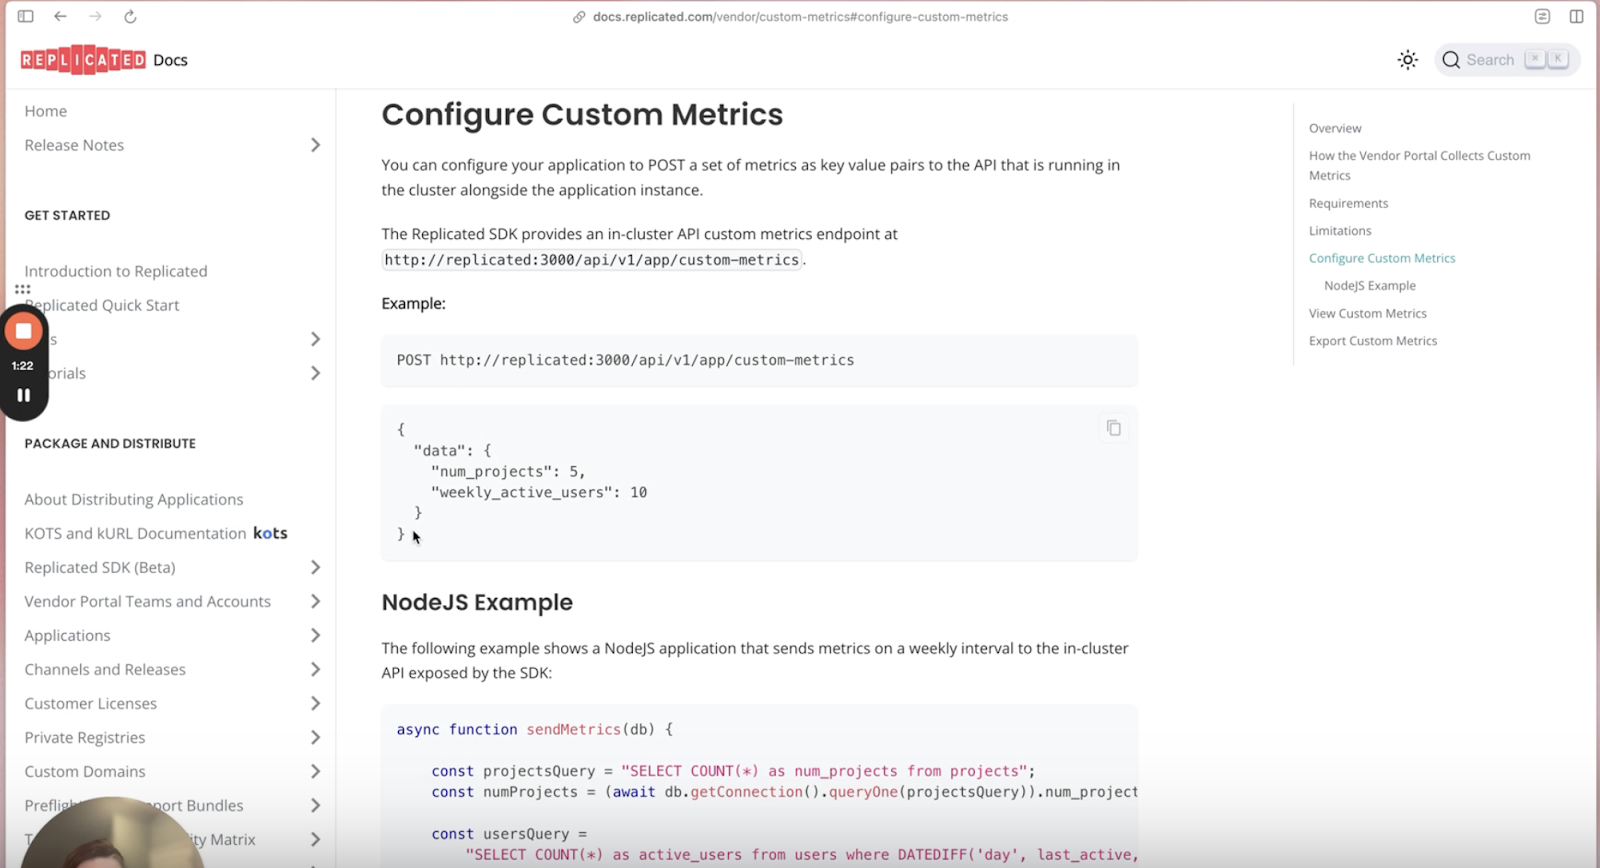
Going back to our docs page, you can send any key value pairs with your custom metrics.
It can be “we have x number of projects” or “weekly active users” here, but you can run wild with your imagination. It can be any numerical, string, or boolean value, and you can send as many as you'd like here.
I'm about to jump into the demo soon. Just as a prerequisite for the demo, you must have the replicated SDK running in your cluster, at least this version or later (1.0.0-beta.12).
Alright, I have a fresh instance up and running. You can see I don't have any custom metrics configured or set up for this instance yet.
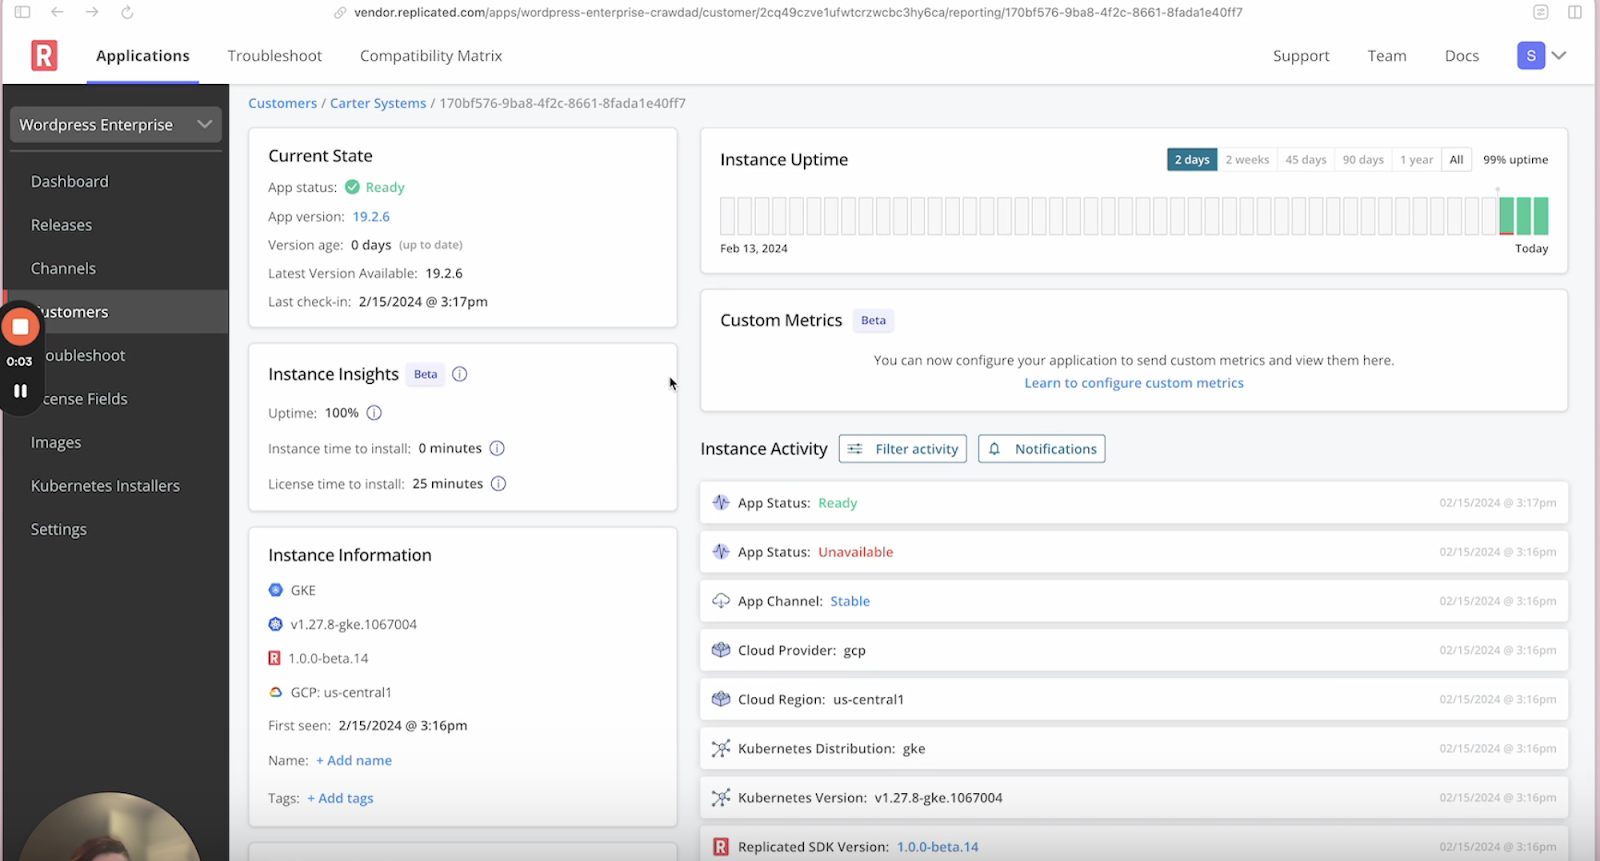
You can find a handy link to the docs if you're wanting to set this up and have another reference.
If I go to my release, I do have the SDK here. And as I mentioned before, that is required in order to be able to send custom metrics.
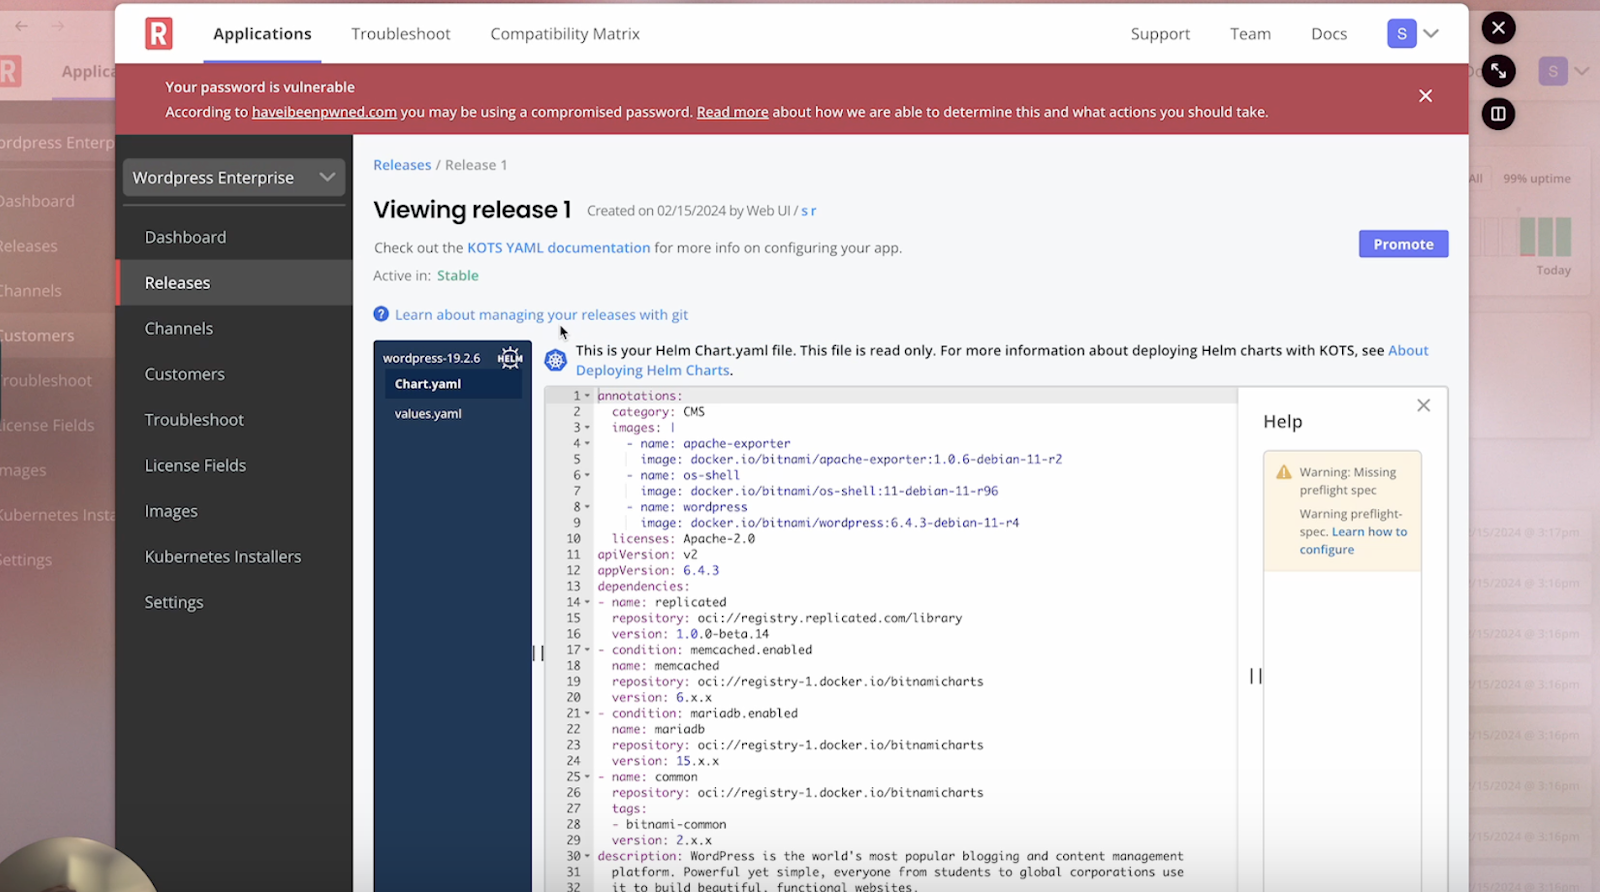
Now I am going to go over to a terminal. I have a payload here that I would like to send.
You can see I have some numerical data about some potential feature adoption or posts created for my WordPress app.

I have just a little bash script here to send this information to the SDK in my cluster.

You can also embed this in your application. We have some Node.js examples here, and you can see how you would declare that fetch request and some of the different or simple examples of things that you could send for custom metrics.
But to go back, I am going to send this.
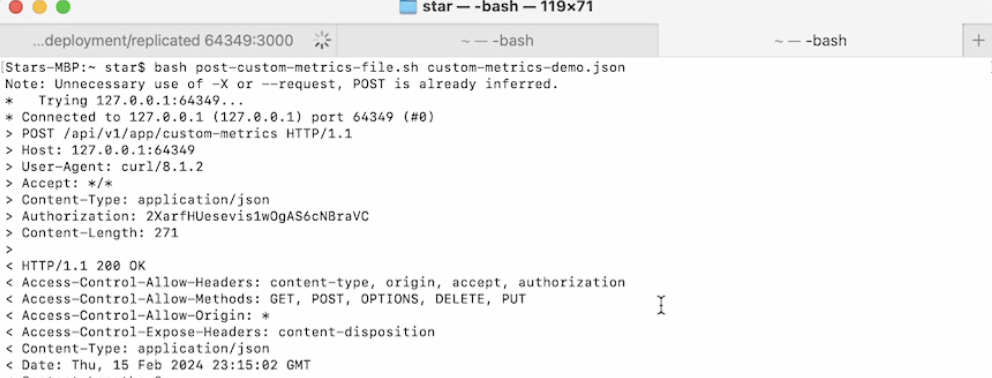
All right, it was successful.
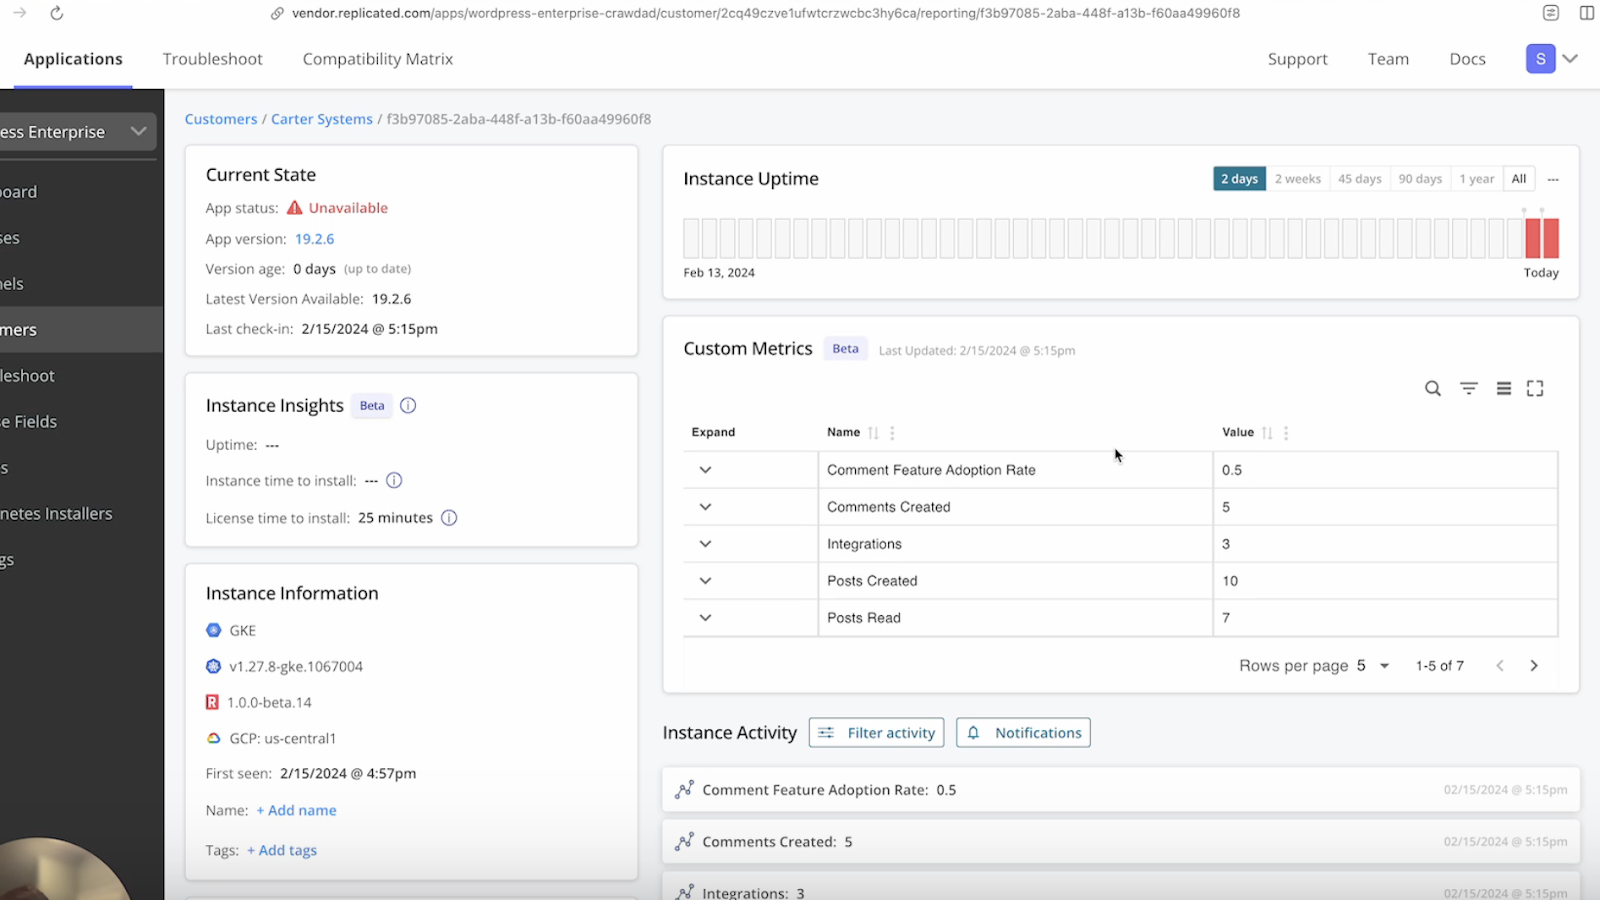
You can see now the custom metrics have populated here. I've only sent one payload, so if I try to open these there's only one data point.
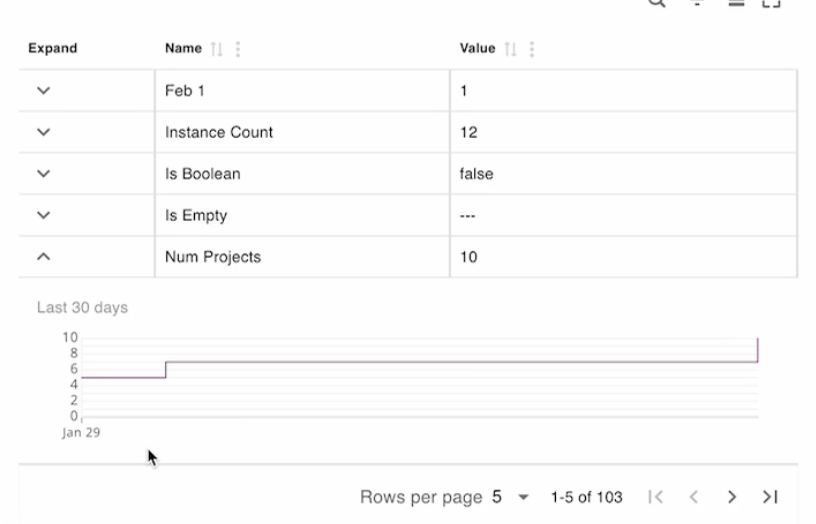
But, if you have some historical data for those, you can see here they'll kind of have a different line chart with steps to tell you how that's changed over time.
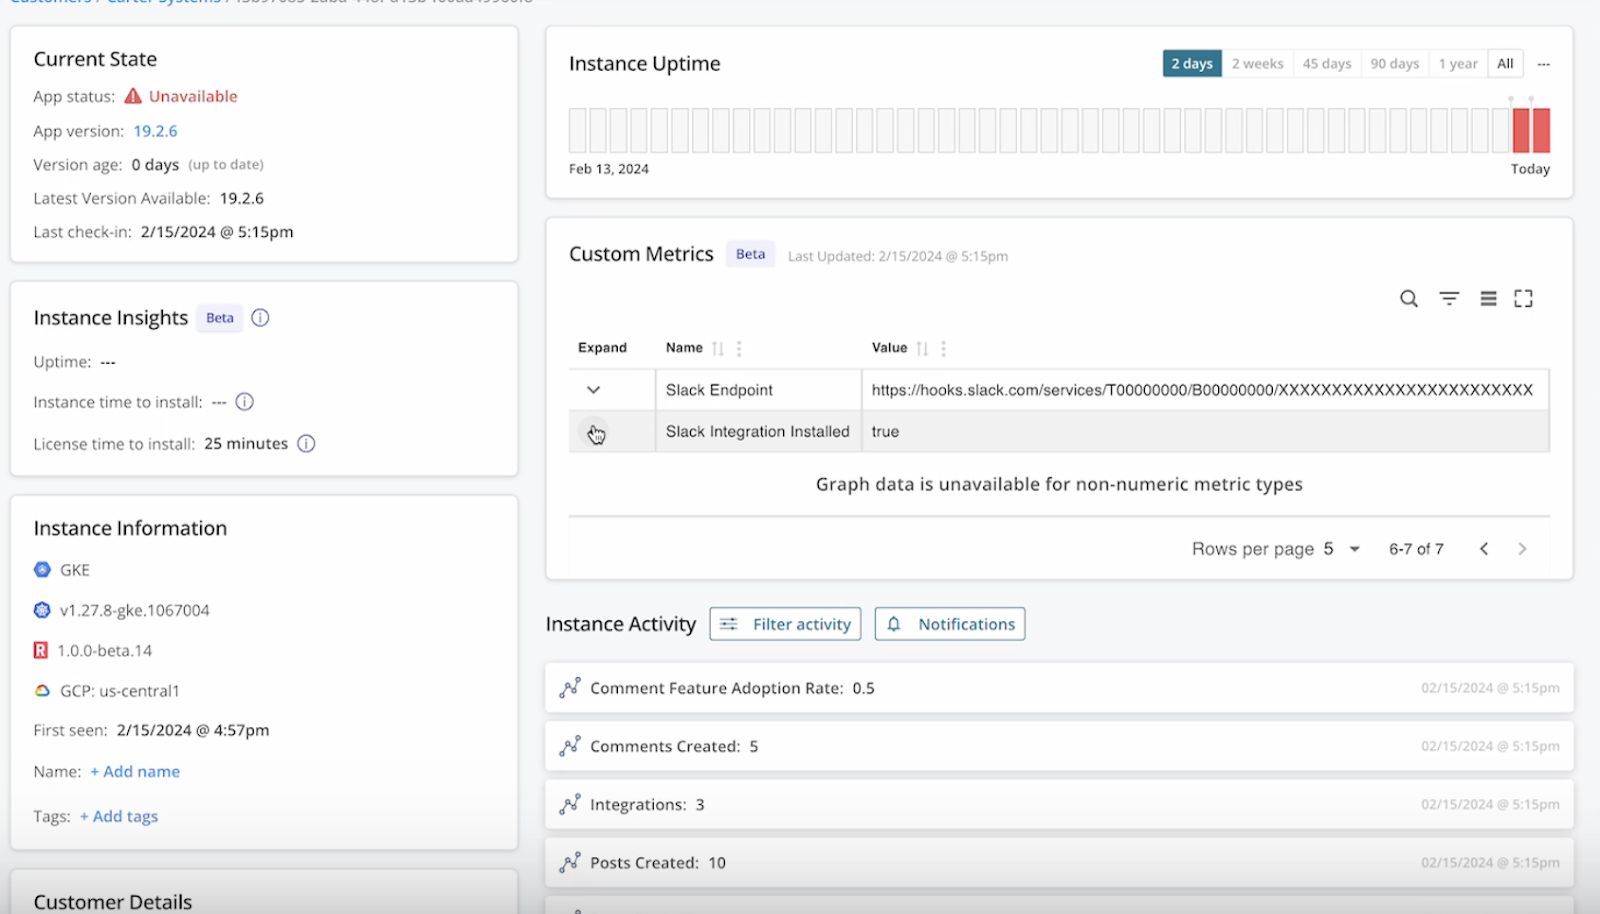
I can scroll through these. You will see if you try to open this, there's no graph data available for non-numeric metric types, and same for this, but you can easily look through these.
You can also search - maybe I just want to find my slack custom metrics, and so on. You can also change this. You can toggle this full screen, and then also change the rows per page. Maybe I want to do all of them, maybe I only want to do five.

Going back to the customers page, now I download my instances CSV:
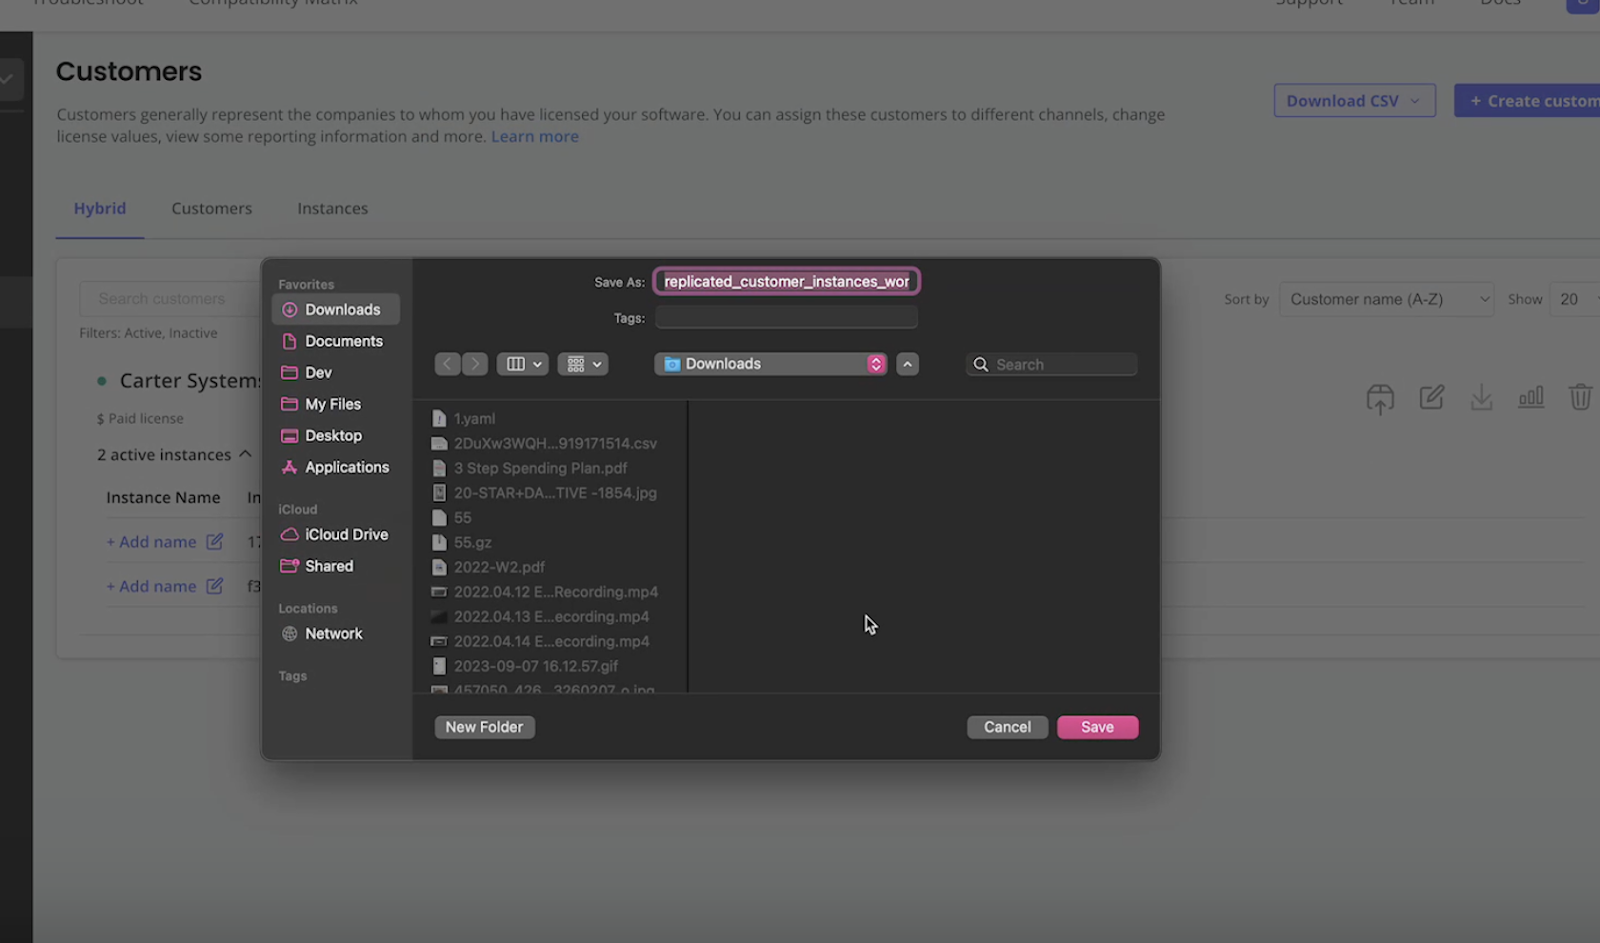
I've imported that CSV into a Google sheet for ease of use.

You can see I have my two instances here, and if I scroll to the end, I can get my custom metrics here.

Then you can export these and use them in any external systems that you'd like. And that is basically all there is to it!
There are some examples in the docs of how you can actually use this in code. And also, just a call out, I did have to set up a port forward since I sent this request not inside of my cluster, I sent it from outside. But, if you were just putting this in your application, you could just hit the replicated:3000 endpoint. This is provided to you by the SDK that's in your cluster. So, that is everything! We hope you love this feature and if you have any feedback or find any bugs, please feel free to send us a request in the Vendor Portal.
Thank you!
Interested in trying out Custom Metrics for yourself? Sign up for a free trial or chat with our team.