The next key metric that we’ll dive into in the Instance Insights Series is the rate at which you’re able to successfully complete the installation of an instance, commonly referred to as install success rate. Measuring your install success rate gives you insight into the quality of the packaging of your software and how prepared you and your customers are to begin each install. Most importantly, a strong install success rate can drive a better customer experience and faster trial conversions.
For the purposes of this exploration, we’ll discuss a hypothetical Kubernetes application that end users install in their own environment, either in a shared cluster or in a purpose-built cluster designed to host only that application. We won’t make any assumptions about how the Kubernetes cluster is created and we’ll even include cases where a vendor includes a Kubernetes installer as part of their application. While some of the notes are Kubernetes specific, most of these concepts should apply to any application that’s distributed into customer environments, including as a linux package, standalone binary, OVA, or other package format.
When beginning the process of surveying your install success rate, you can start by thinking about how many attempts it takes before an install is successful. What percentage of installs require more than one attempt? How often are installs successful on the first attempt? This post will explore different ways of defining install success, evaluating and measuring progress, and techniques and technologies to help improve your application’s performance in this area. With any luck, by the end, you’ll be well on your way to understanding how to achieve best-in-class performance.
Best in Class
Based on our (replicated’s) limited anecdotal experience, best in class vendors have a 90% install success rate, averaging 1.1 installation attempts to get an instance up and running.
Define the “Install Success Rate” Metric
When defining this metric, you’ll need to define some instance install statuses and determine what “installation success” means to you.
Install Statuses
The example definitions provided below are those we have found to be the most common for describing all possible application states as an installation attempt progresses.
- Unstarted - when a customer exists with a planned install, but there is no instance activity reported
- In-progress - an instance for which an install attempt has started, but the application is not yet up and running
- Ready state - an instance where all key application workloads are running and healthy
- Readiness threshold - a defined period of time an instance must maintain a ready state to be considered successful
- Successful Installation - an instance that entered a ready state and maintained it until reaching the readiness threshold
- Failed - an instance that reported activity, but the application itself never reported a ready state, and has since stopped reporting activity and is now considered inactive
For instances managed by replicated, these statuses are reported by default for internet-connected (online) instances. If your customer installations don’t have outbound internet access (air gapped), you can still manually record timestamps for these transitions to understand your performance.
While you may define a successful install differently, at replicated, we define it as an instance that ends up in a ready state and stays there for at least 2 weeks. Defining success in this way ensures that successful installs don’t include instances that become ready but end up in a failed or inactive state soon after. If an instance is deployed but experiences downtime or degradation every 2 or 3 days, this generally signals that additional set-up effort is necessary to stabilize the instance. You should experiment with different values for this readiness threshold and see how it affects the insights your data might surface.
Install success rate is generally represented as a ratio of successful installation to total installation attempts.

Attempts per install is the inverse:

Example
To put some real numbers on this concept, let’s explore an example installation with 3 attempts, 2 failures followed by 1 success.

For this individual customer, the install success rate is 33% or 3 attempts per install.

If the vendor had 9 additional installs that were successful on the first attempt, the total install success rate would be 10 successful installs / 12 total attempts = 83% install success rate, or 1.2 attempts per install.

Evaluate Current Performance
Knowing, or being able to estimate, your current install success rate is important for being able to set a realistic goal. If you aren’t currently measuring install success rate, but you have a team that assists your customers with installs, they may be able to estimate, on average, how many install attempts it takes before one is successful. While estimation and general experiences aren’t reliable data points, they’re a good place to start if you don’t have data yet.
You can use the information gathered during the evaluation of your current install success rate to establish your goals and target specific areas for improvement.
Set a Goal
We recommend setting short and long term goals for install success rate which should be based on current performance. Your ability to identify areas that may be negatively impacting the success of your installs and commitment to addressing and improving these detractors will increase the likelihood of attaining more substantial goals.
Example:
- Short term: Increase overall install success rate to 80% by the end of the quarter.
- Long term: Increase overall install success rate to 90% by the end of the next year.
Measure Performance
Methods of measurement may vary depending on how you define install statuses and success. We’ll be using the definitions from earlier for the examples in this section.
In the example chart below, you’ll see the breakdown of in-progress, failed, and successful install attempts. The install success rate is calculated by identifying the percentage of total install attempts (not including ones still in-progress) that were successful. The in-progress install attempts should be noted, but are not included in the calculation as, at the time of measurement, it is unknown if they will end up as a failure or success.

This example shows a much lower success rate for air gap installs, and this vendor should focus on adjustments to improve the success of those specific install types.
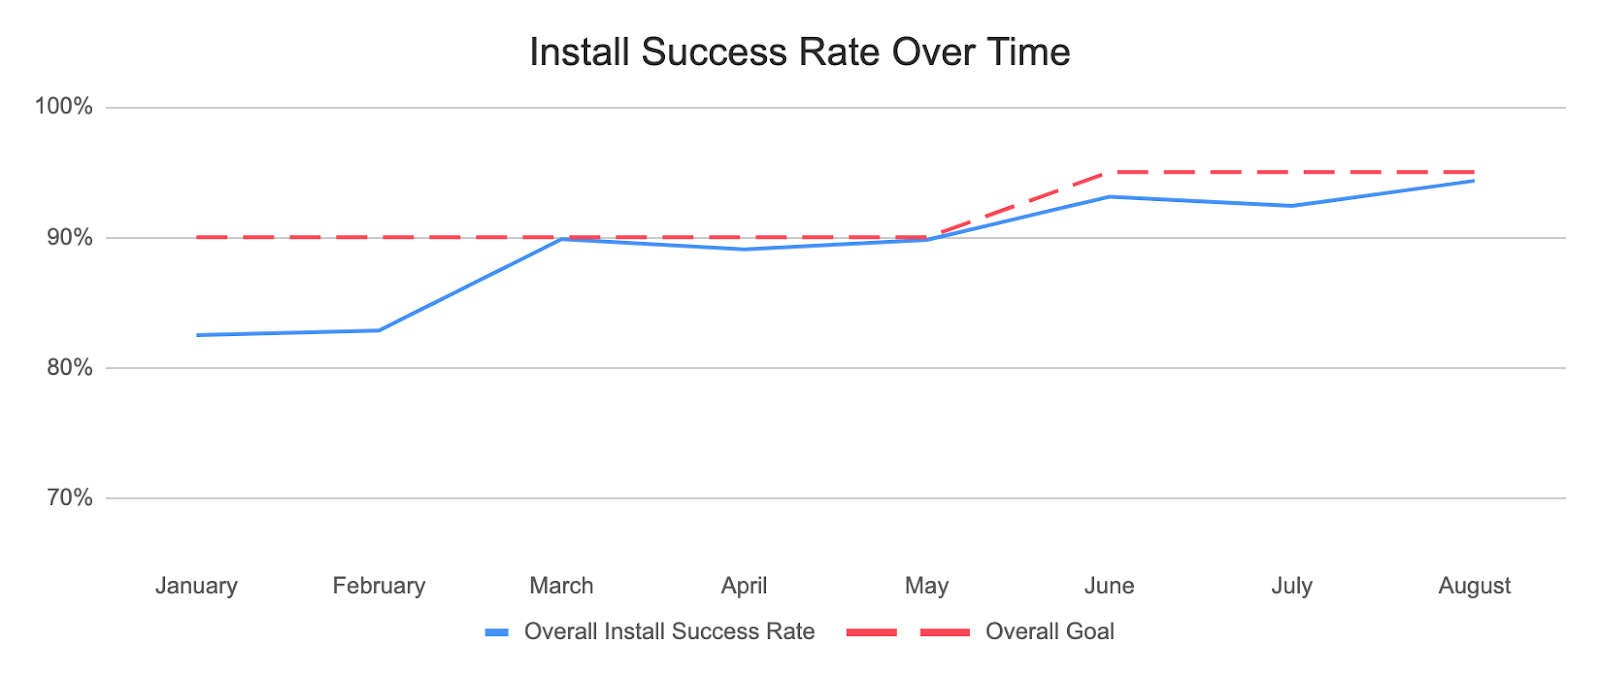
When measuring install success rate over time, you can see the impact that segments with a lower success rate have on your overall performance and how making adjustments to them can help you reach your goals.
Examples of Measuring Performance Over Time
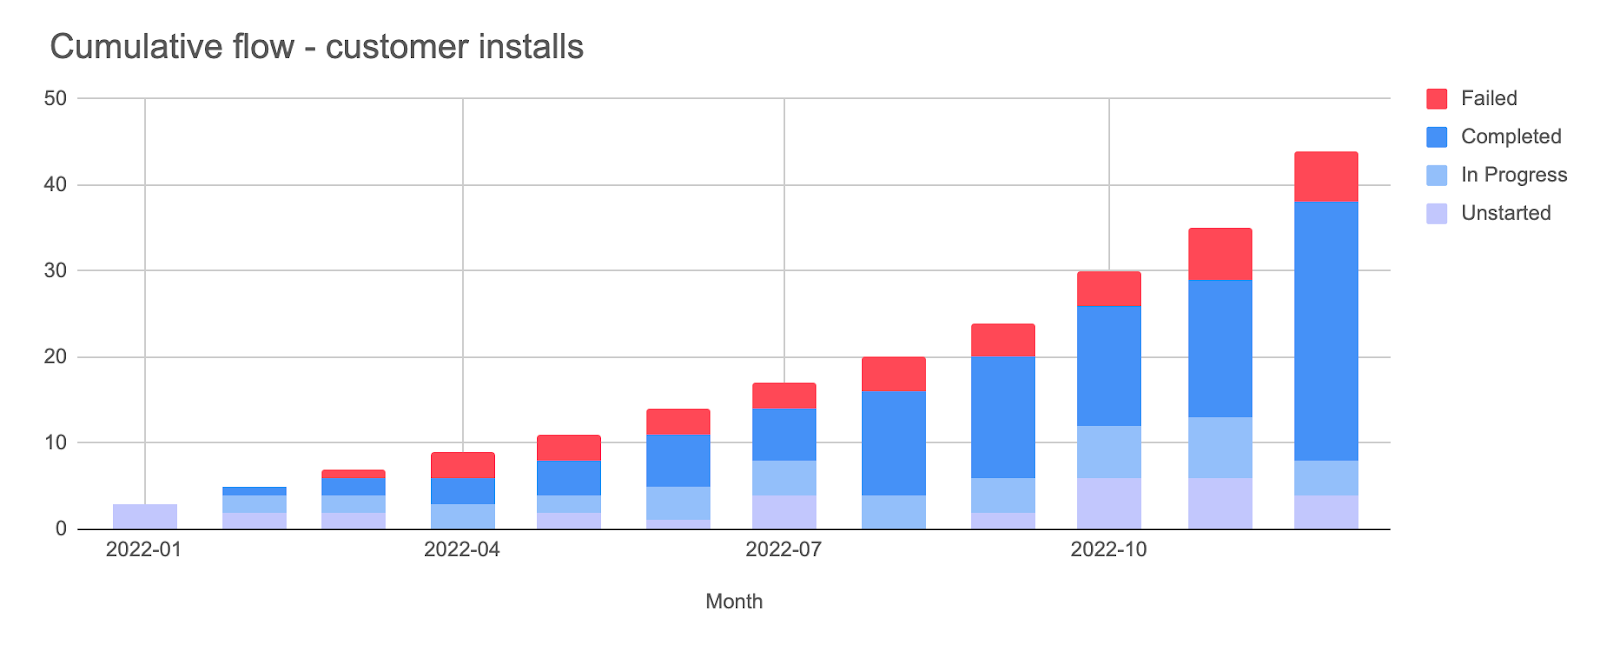
The graph below depicts the cumulative flow of customer installation statuses over time. Visualization of the data can help customer support teams conceptualize the progression of installations.
Many teams also choose to measure their overall success rate in weekly, monthly, or quarterly intervals and track how that’s trending over time, especially in relation to their goals:
Accounting for In-Progress Installations
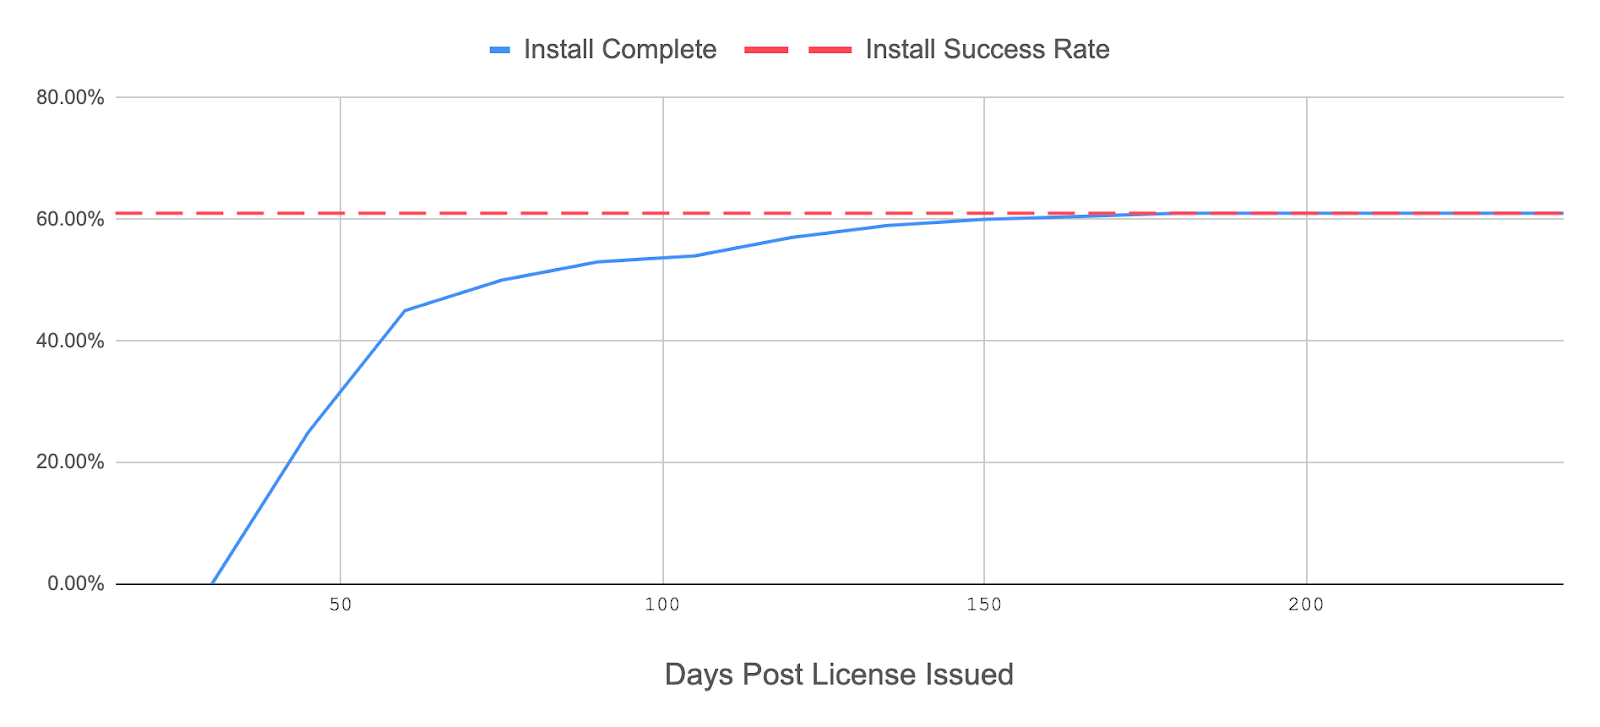
In-progress installations are generally excluded from the total number of installation attempts. However, you may find it helpful to fit a cumulative distribution function to inspect the time window after which install attempts are unlikely to progress further. That is, plot the percentage of customers that get a successful install as a function of the number of days after a license is issued. License issued is an example—as always, you can choose your own “intent to deploy” event. This technique can help you determine which in-progress installs ought to be counted as failed due to how long they have been open.
Make Adjustments to Improve Your Performance
Install success rate is impacted by the pre-install steps that come before your customer or user hits enter on the command line. The key to a successful installation is for you and your customers to be prepared for nuances that may occur during the deployment. The adjustments below are focused on being equipped to begin the install and can help you increase chances of success:
- Matrix testing - If you are distributing your application into a new type of customer environment, it’s important to do test installs in a similar internal environment. Testing in advance of the customer install will help you identify any additional requirements or limitations that may need to be added to the preflight checks or documentation. Continue to build on your test suite as you add environments, and run these tests as often as possible during development. For example, replicated internally maintains a Linux OS test grid for kurl.sh for both development and pre-release testing. Fixing environment-specific issues up front and being able to quickly reproduce and resolve issues helps maintain customer confidence and can increase the rate of success of future install attempts.
- Pre-Install Checklist - Having an automated or manual pre-install checklist can help improve your install success rate. This can be as simple as a shared spreadsheet to manage the list of requirements and dependencies, or as complex as a script or program to check them automatically. Once you’ve tested and documented your app’s requirements and limitations, make it a part of your process to validate every customer environment before attempting an installation.
- Documentation - sharing documentation on prerequisites, installation process, and troubleshooting steps with your customers will help them be more prepared and increase the success of the install. Having members of your team continuously test and iterate on your documentation while thinking from the perspective of a customer helps ensure it’s clear and focused for first-time install attempts.
Adjustments made to improve your install success rate can also have a significant impact on other metrics, most notably your time to install and trial conversion rate. As you iterate, you’ll want to look at what impact your adjustments had on your performance and take them into account as you go back through the define-evaluate-goal-measure-adjust cycle and continue working towards reaching your goals.
How replicated Can Help
At replicated, we are making progress on improving metrics and telemetry within our product to help ISVs understand application health and performance across customer instances. In addition to providing information on individual instance install statuses, data is also rolled up into customer and channel overviews.
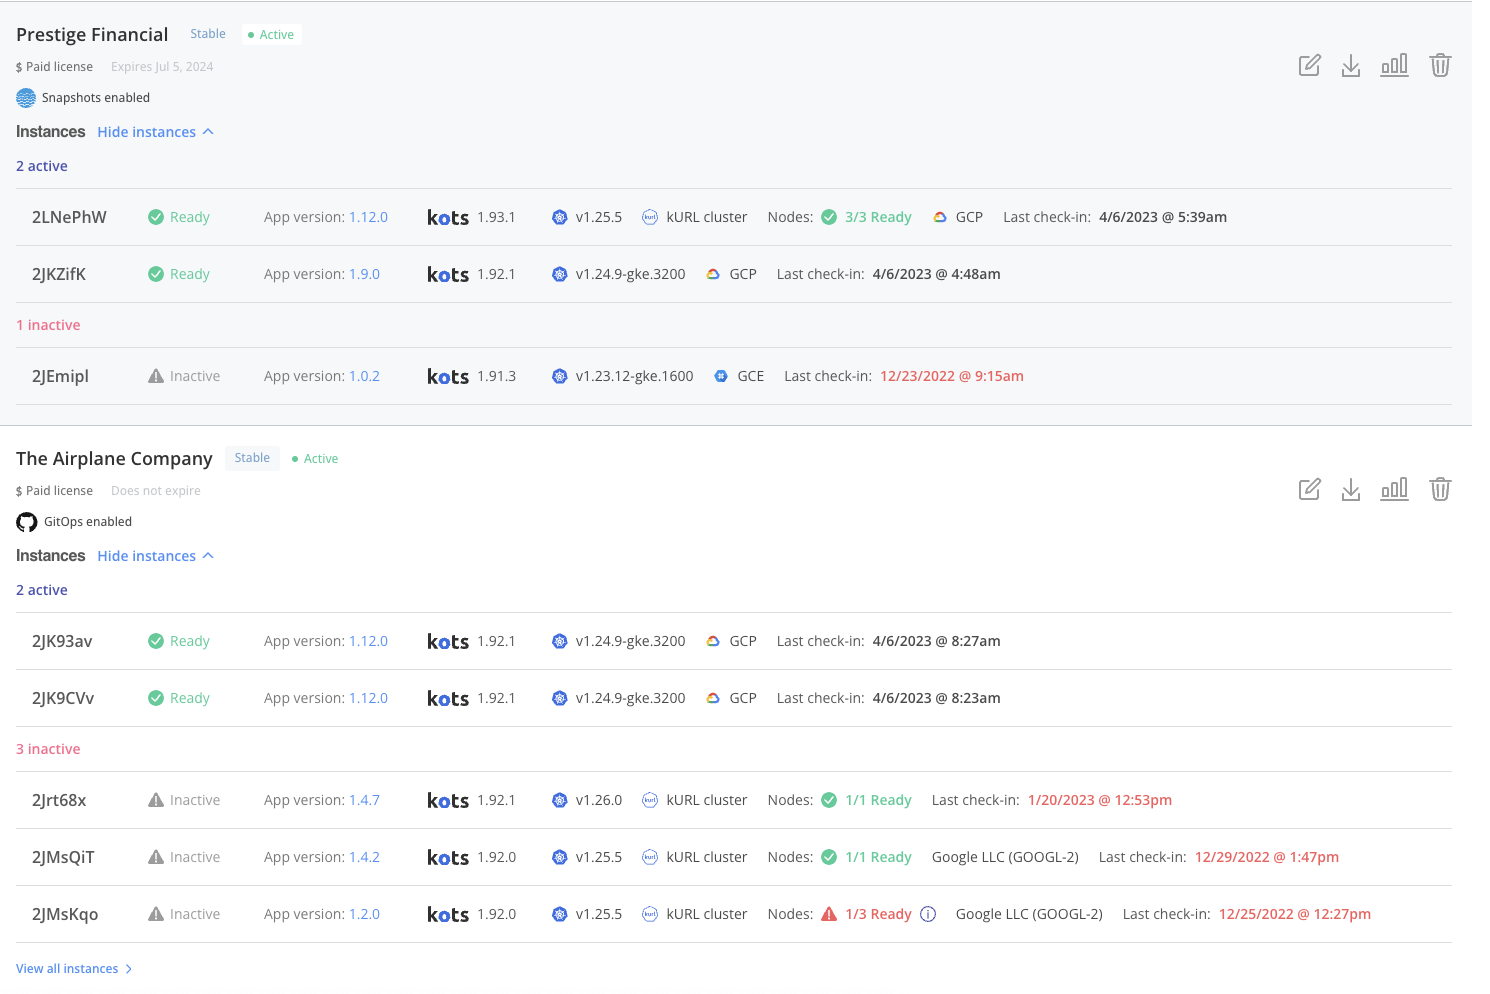
In addition to measuring success rates, replicated has resources that can be used to make adjustments to improve your install success rate:
- Preflight checks - the troubleshoot.sh [.inline] preflight [.inline] CLI is replicated’s purpose-built tool for designing and executing pre-install checklists. It lets you define requirements and dependencies for the cluster or server where your application is being installed. Customers can easily execute the static binary or [.inline] kubectl [.inline] plugin with your requirements spec in their environment in advance of an install attempt. Customizing preflight checks to ensure the customer’s infrastructure meets the needs of your application is an impactful way to increase the success rate of first-time installations. Continue to iterate on preflight checks as you find new limitations or requirements.
- Support bundles - If something doesn’t go as planned and an install attempt fails, you can speed time to remediation by having end customers collect a support bundle. While the default support bundle contains a lot of useful cluster and node information, you should also create custom collectors and analyzers. These custom configurations can gather specific information related to debugging and diagnosing failures in your application. Understanding why an install failed and taking steps to automatically detect the issue in the future will increase the chance of success of future installation attempts.
- Documentation - replicated has a documentation starter repo that can be used as a starting point for creating effective documentation.
- Coming soon improved reliability testing capabilities - replicated is building out new capabilities to help you gain more confidence that your new release will work well in your end customer environments. Sign up for the Foundation Plan waiting list to be kept in the loop as this work proceeds.
Learn More
- Stay tuned for future Instance Insights, next up: adoption rate and age of deployed software
- Recent product enhancements: improved customer instance telemetry & improved customer reporting
- Follow our roadmap item for Instance Insights for more updates as replicated’s efforts on measuring and reporting evolve over time.
- Want to explore Instance Insights, but can’t use replicated’s installers due to internal or customer requirements? Check out the Foundation Plan waitlist
- Not a replicated customer, but interested? Schedule a demo with us!