Today, we’re excited to announce new and improved ways to export and explore data about your customers and their instances.
We've heard from customers that they want instance data in the hands of their analysts so that they can combine it with other data, like from CRMs, and build custom analyses and reporting. We are introducing three ways to do that now.
- CSV -- for doing quick analyses, like creating a pivot table on how many instances are running per app version
- Instance Export Endpoint -- for constructing repeatable reporting, e.g. extracting configuration details daily and using them to drive a Tableau dashboard
- Bulk events export -- for the team that wants to analyze time series data, like “instances on each kubernetes version over time” or “time to install by customer cohorts”
Why we built Data Export
In working with the 100+ software vendors who use replicated to deliver their customer-hosted software, we’ve found that teams working at scale need good data to make the right decisions. While exposing this data in the vendor portal via several collection and reporting features was a great start, we found that this wasn’t enough once teams started to hit 20-30 customers and beyond. These teams are using data about their customers’ instances and usage to drive decisions at the product, sales, and strategic levels, and we found that many software vendors wanted to consume this information from more centralized places than the Vendor portal:
- In a CRM system like Salesforce or Gainsight
- In a Data warehouse like Redshift, Snowflake, or BigQuery
- In a BI tool like Looker, Tableau, or PowerBI
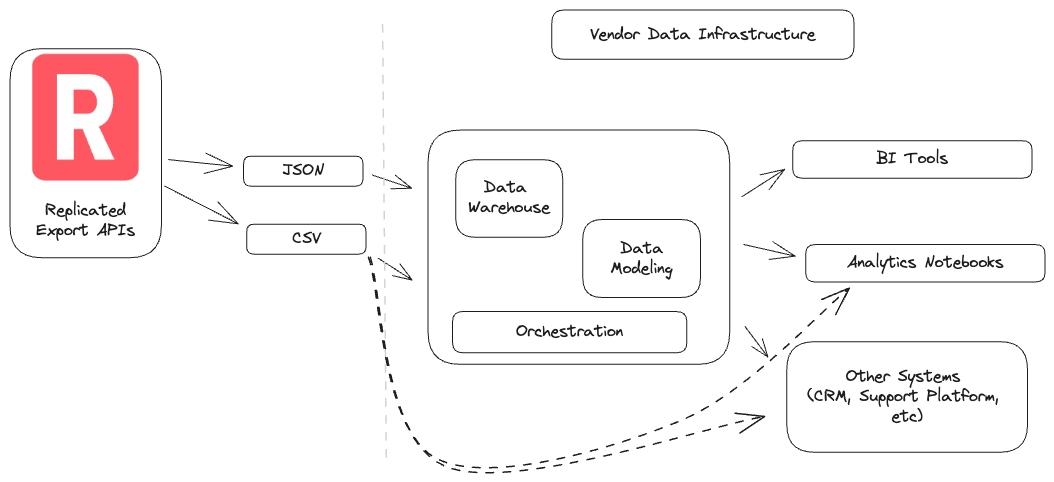
At the core, we wanted to deliver features that would allow analysts, analytics engineers, data engineers, etc to make the most of this data. With new options for CSV Instances Export, JSON Instances Export, and Bulk Event Export, vendors now have the option to review data in the Vendor Portal, or export it via APIs or CSVs into any other system. We hope that in making this usage data available, we’ll enable your team to make better decisions about where to focus efforts across product, sales, engineering, and customer success.
The Instances CSV

While some teams have been using the existing export methods for years, we wanted to address several shortcomings in the current methods:
- The Customers CSV lacks many of the details that we can now provide since delivering the enhanced Instance Detail page
- The Customers CSV only delivers one row per customer, and when a customer has multiple instances, arbitrary aggregations needed to be performed across instance-specific fields like app status and app version
- For example, the customers CSV will show the app version of the most-recently-checked-in instance, which may or may not be ideal for a specific use case.
The new report addresses both of these by providing a report that adds a number of useful columns, and delivers 1 row per instance so that you and your team can decide if and how you want to aggregate data for a customer.
Once you have it, you can process that CSV and/or move it into your tool of choice. The below example uses Google Sheets:
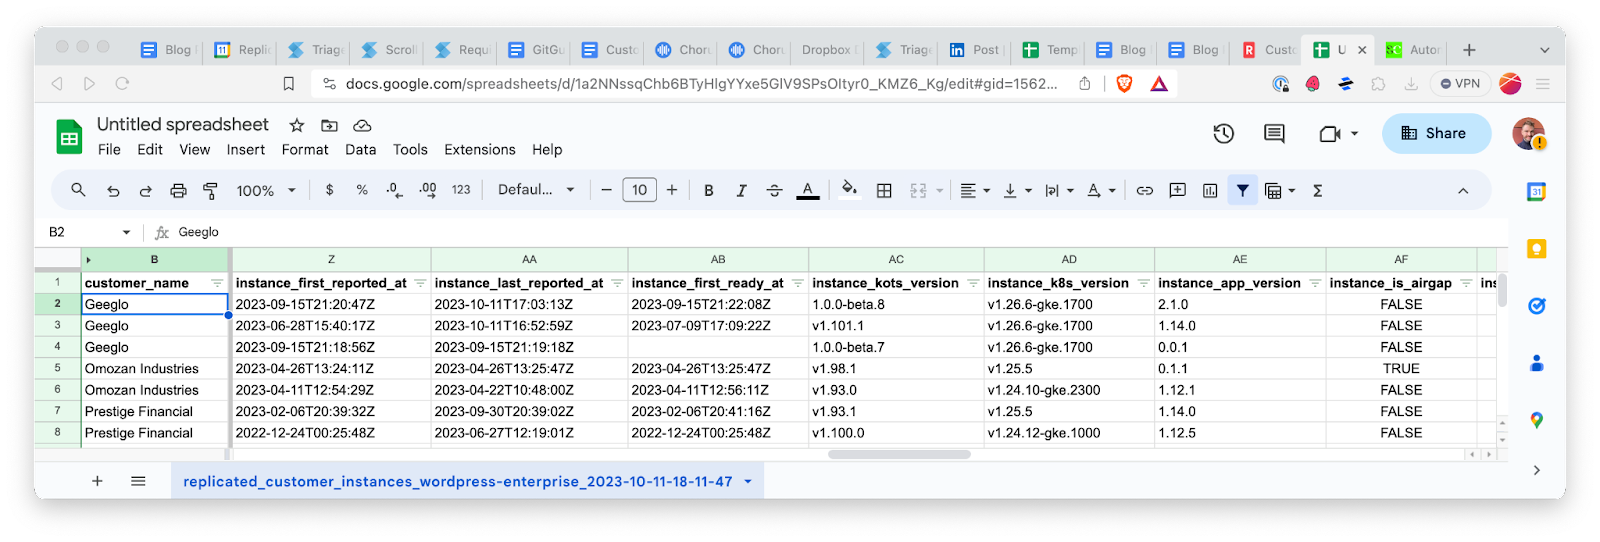
Some notable new data points here are:
- Improved accuracy of cloud provider reporting, plus reporting for cloud provider region
- Reporting of KOTS version and Kubernetes Version
- Fields like customer_created_at, instance_first_seen_at and instance_first_ready_at for analyzing install timelines
- Inflated JSON payloads into independent columns for Custom Metrics and Entitlements
For a full list of columns with data definitions, see: Export Customer and Instance Data.
The Instance JSON Endpoint
While CSVs provide a simple standard for export, we also know that for some teams, CSV management can be complex. JSON APIs give benefits like typed data, OpenAPI schemas, and generally just tend to be easier to consume and parse. This is true for both simple scripts and for workflow orchestrators like Airflow or Meltano.
We identified multiple issues with the existing JSON methods for exporting data
- There are multiple possible ways to get similar data, but no go-to endpoint optimized for export
- Existing endpoints all include some amount of noise that bloats payloads and makes them harder to work with
- Some existing endpoints lack sane defaults and controls for filtering out inactive instances or archived customers
To that end, we’re publishing a new endpoint for exporting instances data as JSON. You can see an example request/response below
JSON export is further documented at Export Customer and Instance Data in our docs site.
Bulk Exporting events
Knowing the state of every instance is valuable, but we find that analysts and analytics engineers are also trying to answer a lot of questions that revolve around knowing the history of an instance. For example:
- Based on historical trends, what % of instances could be expected to experience downtime in a given week? Is this getting better or worse over time?
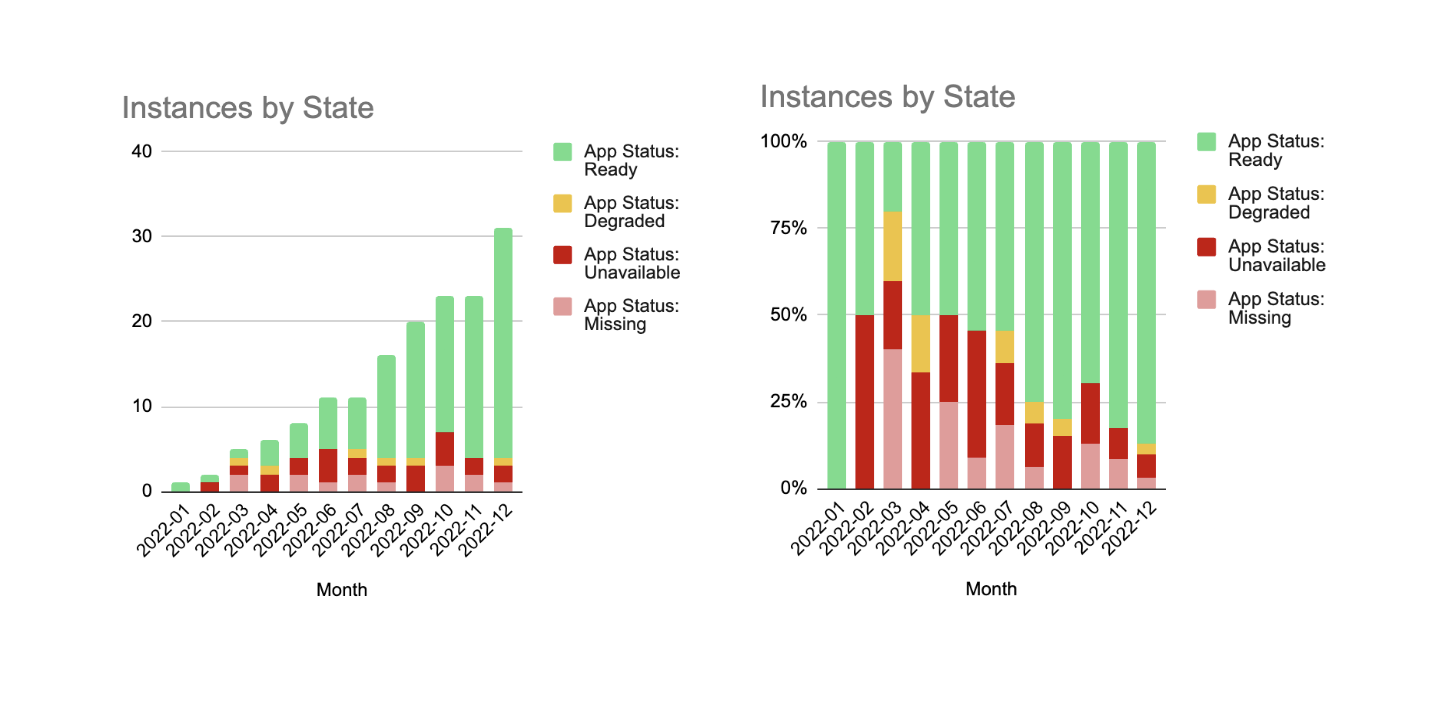
- What % of trial licenses install successfully? How long does it take for trial licenses to be installed? What % of those convert to paid licenses? How long does conversion take? How does this differ across different cohorts of customers?
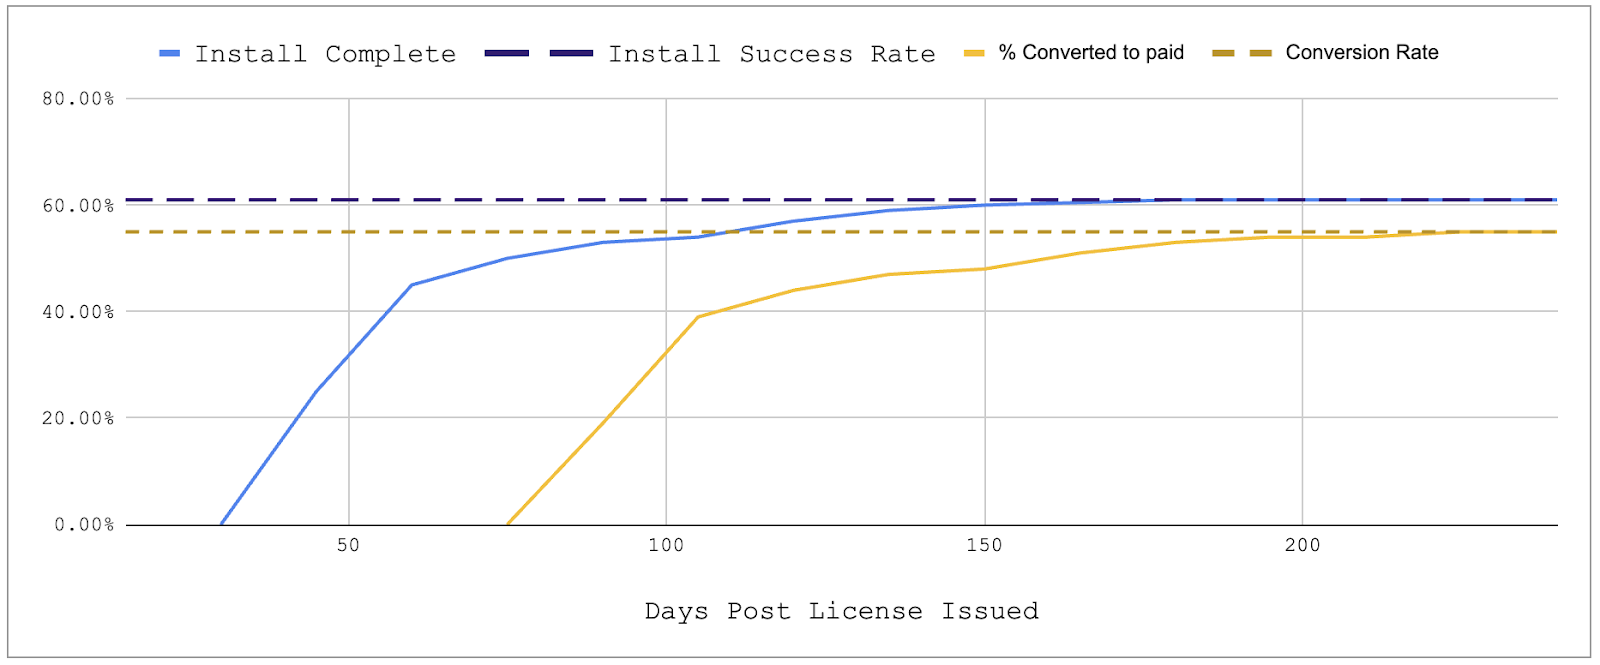
- Across all issued customer licenses, how many installation attempts are in-progress? How many were started but have now been abandoned?

By analyzing historical time-series data, vendors can:
- Identify trends and potential problem areas before they become overwhelming
- Demonstrate the impact and success of recent product, process, or tooling initiatives
- Empower teams to understand how they’re doing and apply all of their creative thinking to solving the core problems in on-premise software
While some of these time-series style views could be “hacked” by querying the current state of all instances regularly and snapshotting the changes, we wanted to provide first-class support for understanding the history of instance upgrades.
To that end, we’re publishing a new endpoint that allows for fetching events for all instances and customers.
Example Request / Response
From this data, any historical / time series views can be constructed. The data can be filtered by date range, event type, and more.
Tying it all Together
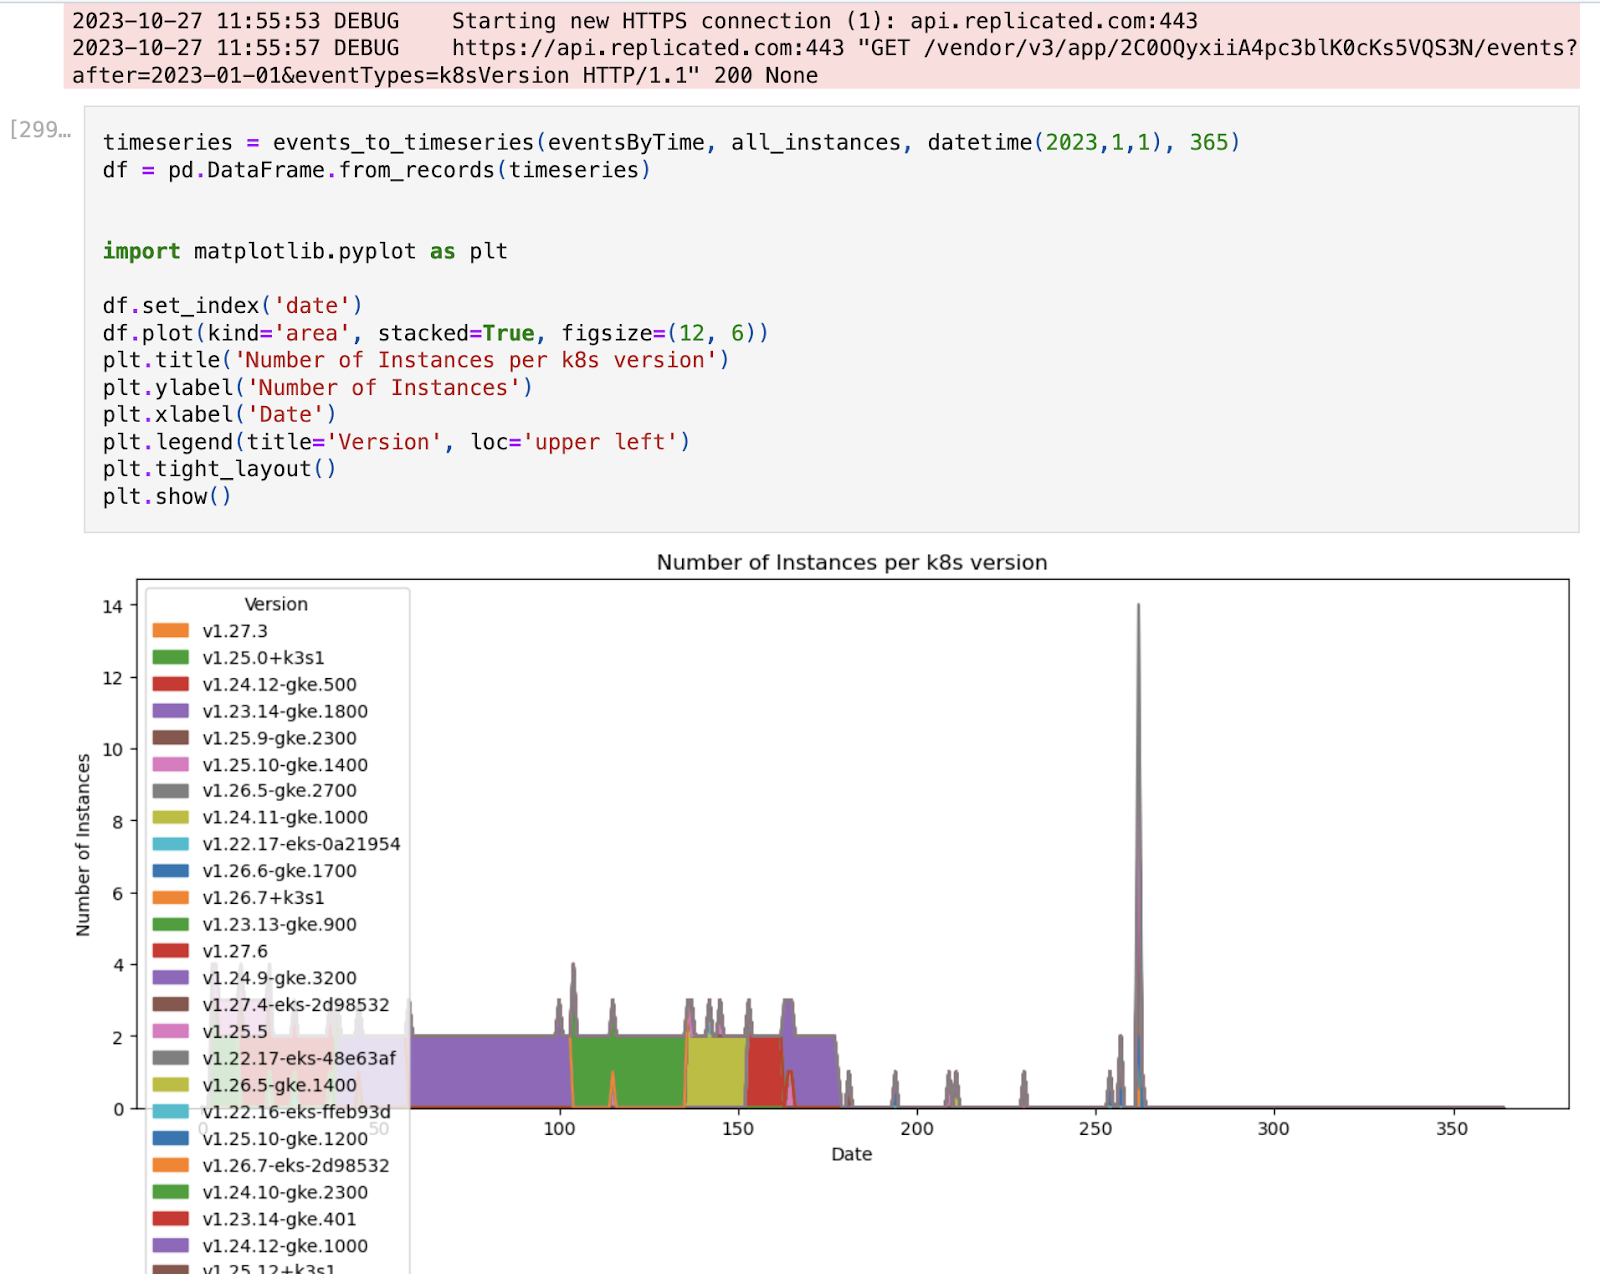
To demo this functionality and what’s possible with it, we’ve open-sourced a few Example Analytics Notebooks showing some analyses that can be done with the replicated data, including a Kaplan-Meier analysis of time-to-install, an example of using Meltano to load CSV data into a SQL database and query it back out, and some timeseries analysis of Kubernetes Version Adoption. We hope this serves as inspiration and guidance as you explore these features!
Next Steps
We’re looking for feedback on this functionality. If you’d like to be a design partner, please log a feature request. While API and CSV export is available today, we’ll look to continue improving the integration points that enable you to move this data into the systems where you need it. We’re also actively developing functionality for enabling telemetry collection from air-gapped environments, and will aim to include Data Export in that work. If you’d like to be an alpha tester for air-gapped telemetry, let us know.
Want to learn more about what replicated does to help vendors distribute software to self-hosted environments? We would love to show you -- click here to schedule a demo.