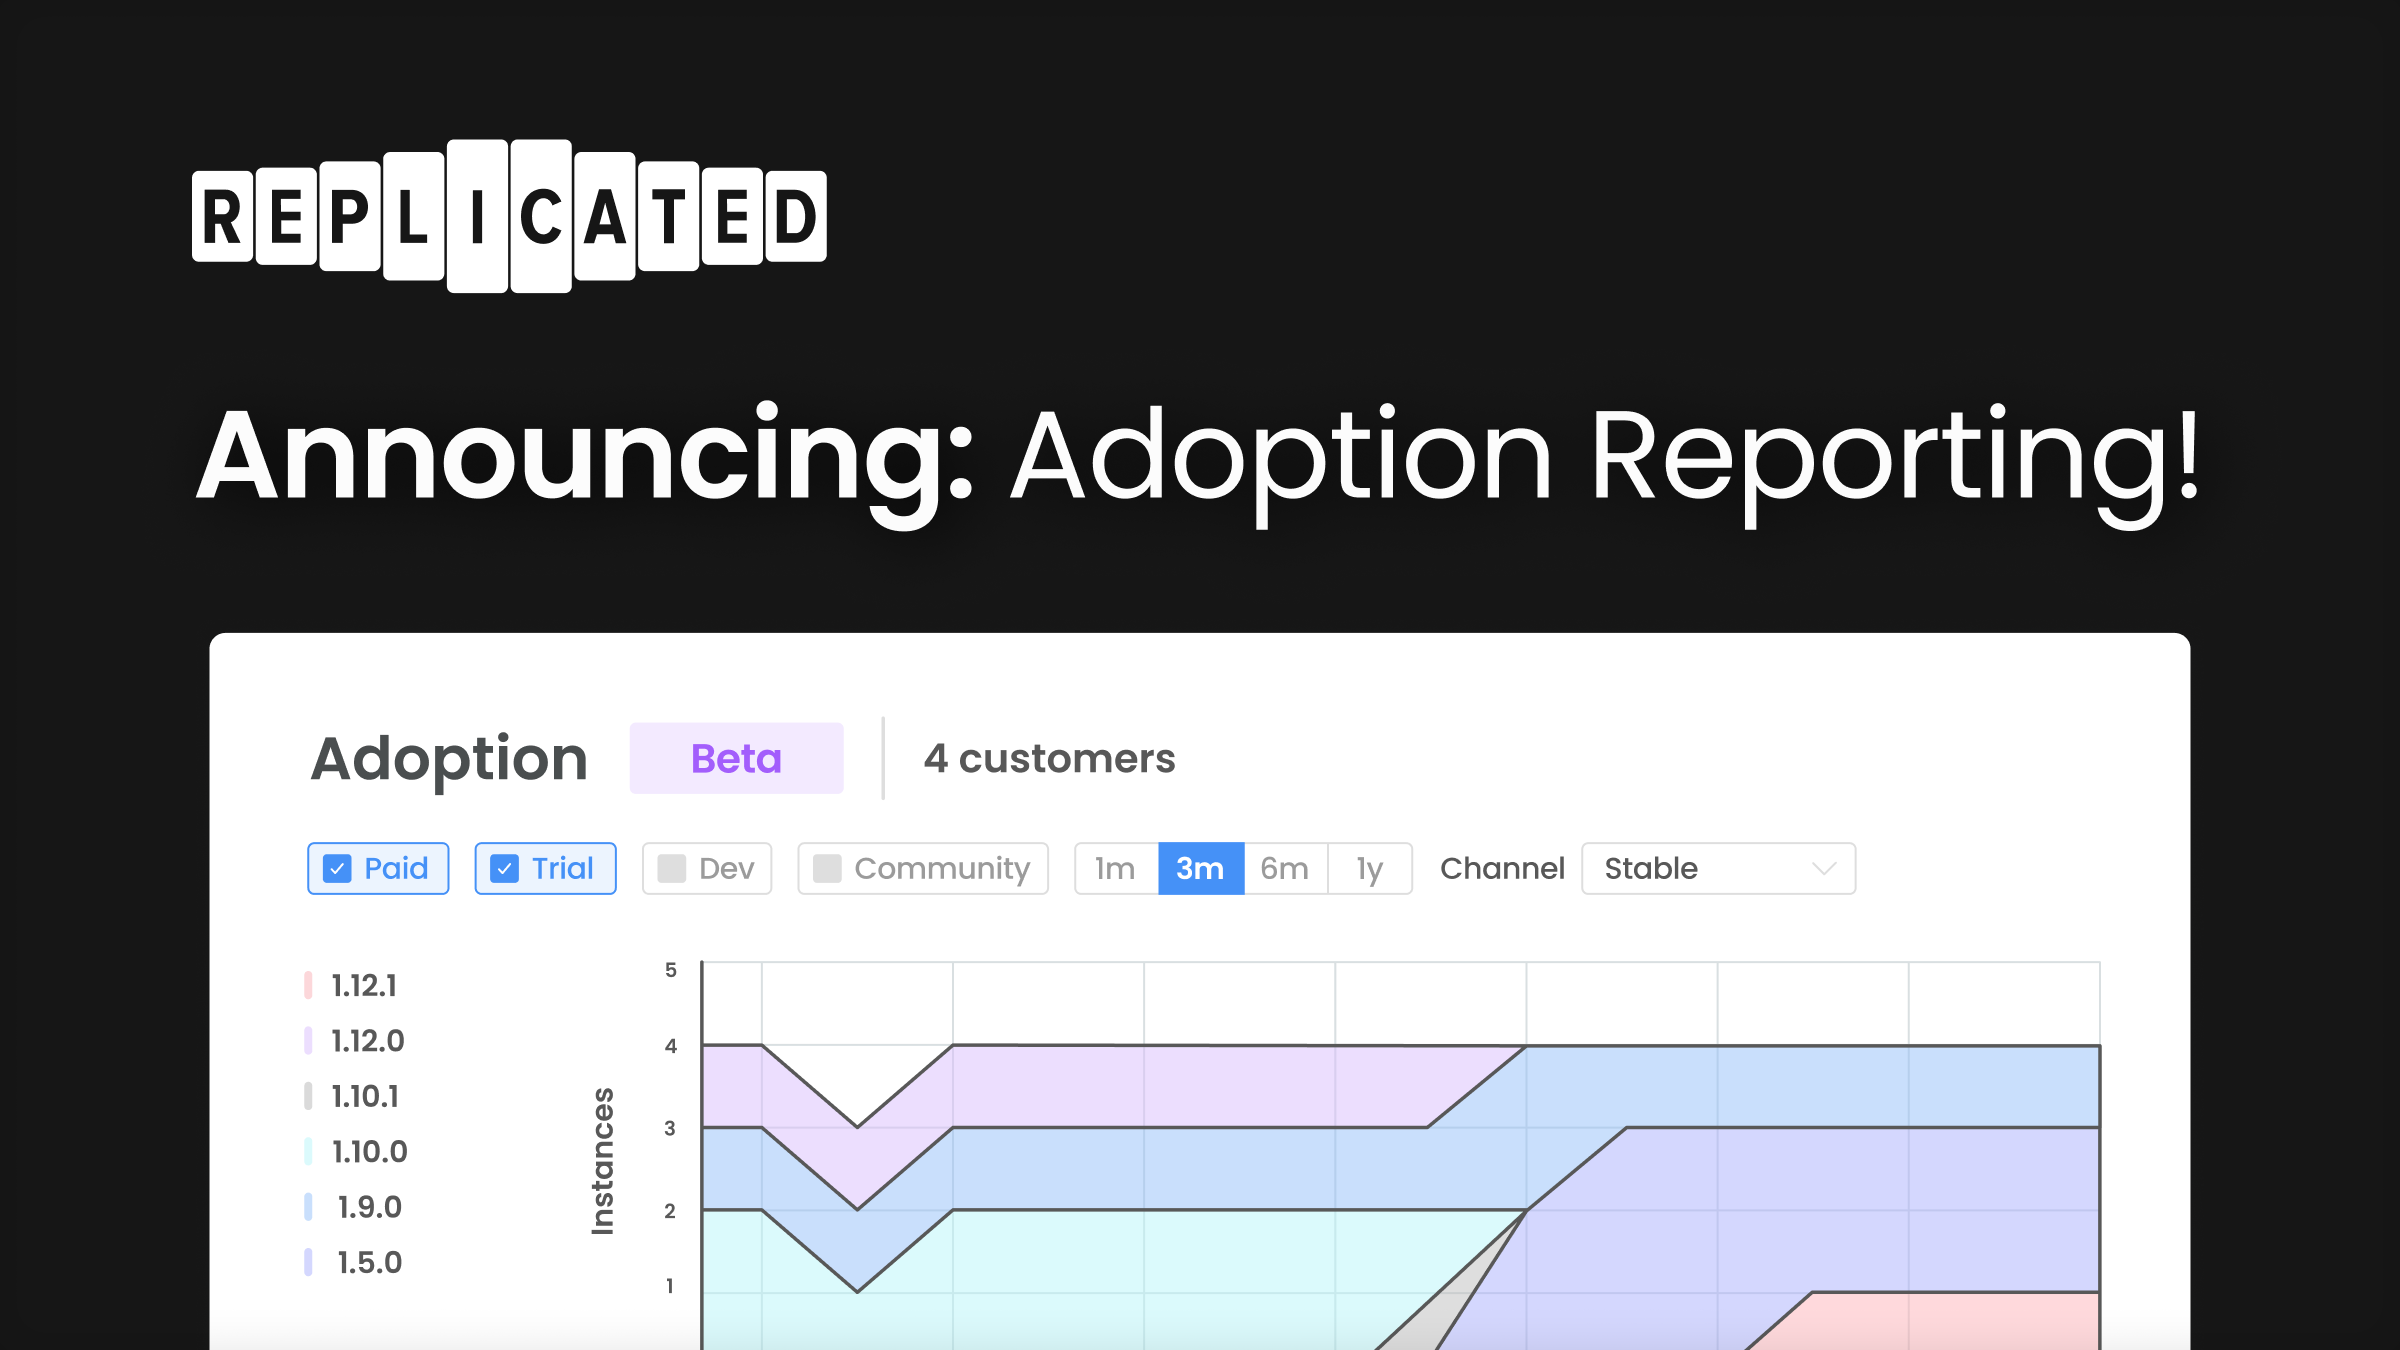
One of the most valuable indicators of the quality, reliability, and ease of use of a distributed software package is New Version Adoption -- the consistency and timeliness with which end users adopt and deploy new versions. Today, we’re thrilled to be launching some brand-new adoption reporting in the replicated Vendor portal. Building on the work in Improved Instance Telemetry and Improved Customer Reporting, replicated customers can now see key version adoption data rolled up across all their customers. This adoption report will provide not only at-a-glance tactical and operational details, but also key strategic metrics for understanding and improving the quality of the software you distribute.
This report will help answer tactical questions like:
- Which of my customers are stuck on old versions? Which versions are they stuck on?
- How quickly are customers adopting new versions of my software?
- What is the distribution of software versions among my user base?
- How effective are our communication and marketing efforts for new releases?
- How is my release cadence impacting software adoption?
As well as strategic drivers like:
- Where are my biggest product adoption bottlenecks?
- Am I getting better or worse at improving these capabilities over time?
Why Measure Adoption?
We have added visibility into these metrics because you can't improve what you can't measure. Our hope is that you, as a replicated vendor, make this data a critical part of measuring the ease of use and general quality of the software you distribute. The mechanism here is simple: if the process of upgrading is simple and straightforward, customers may be more likely to upgrade their software, which can help to ensure that they are using the most up-to-date version. On the other hand, if the upgrade process is complicated, error-prone, or time-consuming, customers may be less likely to upgrade, which can result in them using outdated or vulnerable versions of the software. In Making Software Distribution a Core Organizational Competency, senior and founding members of the GitLab distribution team called out that adoption drives the key “North Star” performance metrics for the team.
Our main performance indicator that the distribution team is working against is our upgrade rate, which is the percentage of instances on the latest three versions of GitLab.
-- Dilan Orino, Senior Product Manager, Distribution, GitLab
We’ve seen time and time again that the rate at which you can keep your customers on recent versions of your software has great impacts on many areas of your business, including product, engineering, sales, customer support, and customer success.
Who it’s for
Product and Engineering
The ease with which customers can discover and execute new upgrades can be an important factor in determining the quality of a delivered software package. Adoption rate metrics like Upgrades Completed, Versions Behind and Relative Age of Deployed Version are an invaluable tool for measuring the performance and quality of the package you’re shipping to customers. For product and engineering leaders, the Adoption report gives tactical awareness and helps create aligned, empowered teams.
As a product manager, I want to see which versions of my product are deployed at customers so that I can follow up with customers on really old versions, determine the right release cadence so we don’t release too often with minimal uptake, and figure out why customers are staying on a specific version--maybe there’s a breaking change or something difficult about the upgrade.
-- Nick Walker, Principal Product Manager, Stormforge
Customer Success, Support, Solutions, and Sales
Beyond indicating product performance, “carrying” many older versions out in the field can be an efficiency drain on your customer-facing teams. Older versions tend to be less stable than newer versions, and in many cases become a support case waiting to happen. More unique versions means more quirks and intricacies for which your team will need to maintain documentation and internal expertise. But most importantly, for customer success and sales leaders, getting customers to adopt new versions is key to ensuring they see continued improvement in the value they get from a product. Metrics like % of instances on the last three versions and unique versions in production can help you get a handle on these older versions and set clear goals for teams around improving adoption.
As a leader of a group of Pre/Post-sales engineers at replicated, I experienced first-hand the customer pain and frustration that can result from getting stuck on old versions of software. The same bugs get reported over and over, even though they’ve been fixed for months in newer versions. The longer customers go without updating their version, the harder it is to finally get them through the increasing number of manual / breaking updates that inevitably make their way into product release cycles. At replicated, we’ve even posited that slow adoption can be a leading indicator of customer churn (stay tuned on more research for that).
On the other hand, delayed adoption can signal to Success, Solutions, and Sales leaders that customers aren’t seeing enough value in more recent versions to justify the effort to upgrade. This can and should impact how leaders think about go-to-market, product fit, and ideal customer profile.
If we have customers who are staying on old versions - we’re likely not building things they care about, or we need to work on our ideal customer profile.
-- Lance Larsen, Head of Solutions, Opal.dev
Product Marketing
Knowing how quickly new versions are adopted can be a really clear indicator of the quality and effectiveness of efforts to market new versions. Highly effective communications should result in a large uptick in adoption within the first few hours/days of version release. Having this data at hand can help you set new version adoption targets.
replicated’s adoption reporting helps me better collaborate with our product marketing team to understand the effectiveness of our customer communications that go out when we release new versions.
-- Barry Gleeson, Senior Product Manager, SmartBear SwaggerHub
Security
Every Security Leader strives to use the most stable and secure software versions. Security staff appreciate it when vendors respond quickly to fix security issues, but one of the key challenges with customer-distributed software deployments is understanding what live versions may have active vulnerabilities or exploits. Even the most nimble teams who can ship a CVE patch within hours of announcement may be at risk if it takes 3 months to get the patch version(s) rolled out to their customer base. Visibility into the count and quantity of customers on specific versions helps Security Leaders tune release cadences while developing effective, targeted communication to drive the adoption of patched versions.
Security teams want patches. Vendors release often. But the reality is that a given enterprise may only adopt a new release 3 times a year. Using adoption metrics can help a vendor better understand the (probably slow) pace of Enterprise adoption, and tune the contents and cadence of releases accordingly.
-- Andrew Storms, VP of Security, replicated
How it Works
Adoption Graph
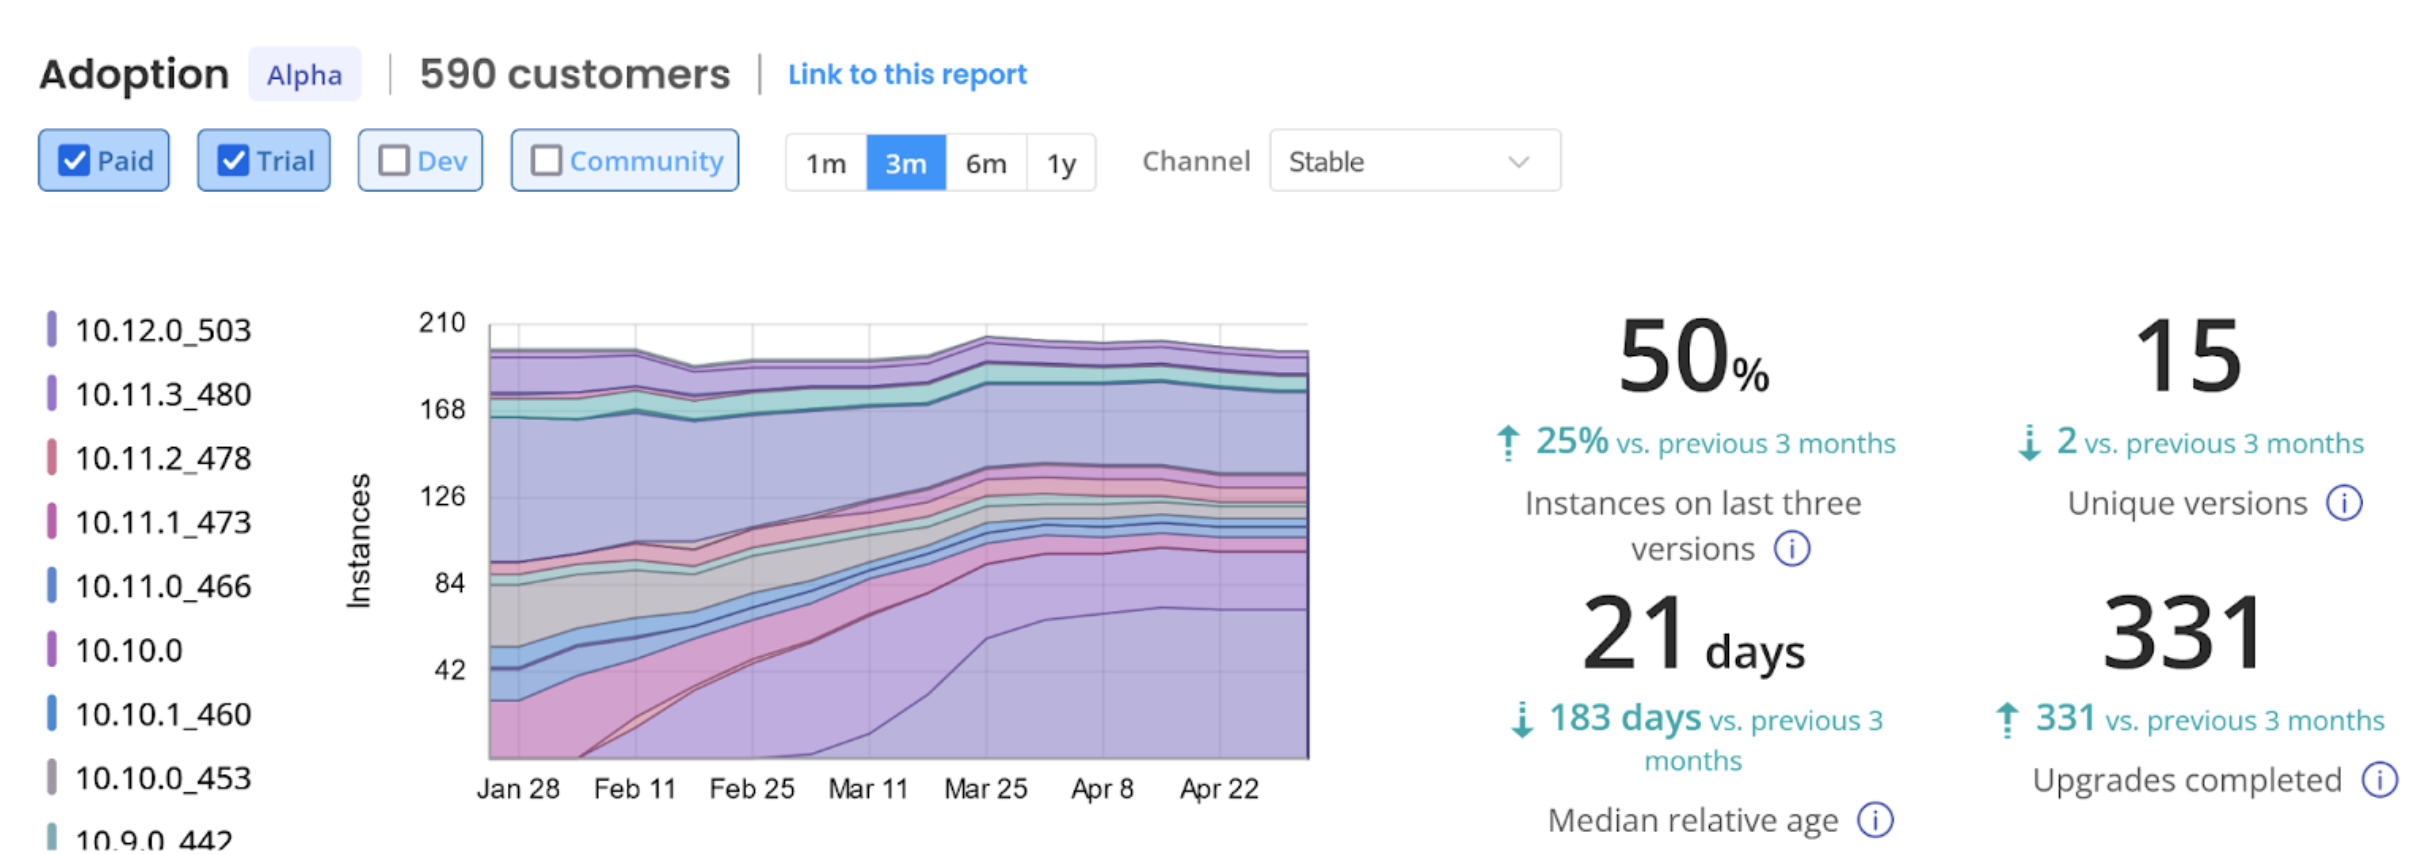
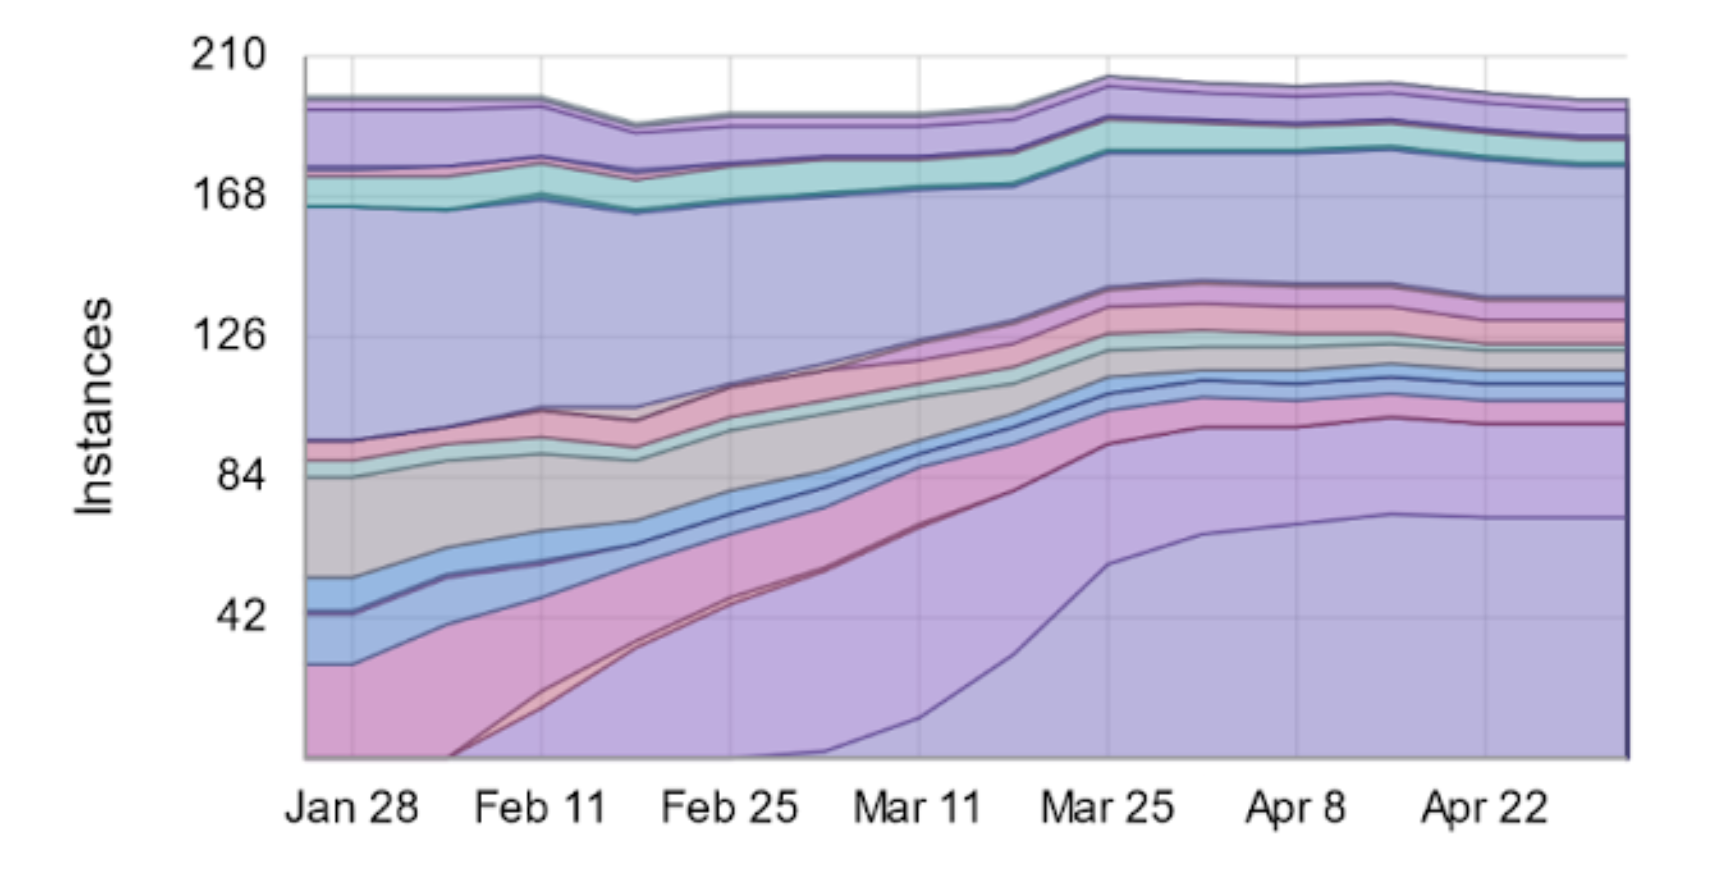
The Adoption Graph shows, for each week in the reporting period, how many active, online instances were running a specific version. It’s worth noting that this is instances and not customers, -- an end customer might have multiple instances on one or more versions. Hover a region to see the number of instances in more detail. Newer versions will be shown toward the bottom of the graph.
Key Metrics
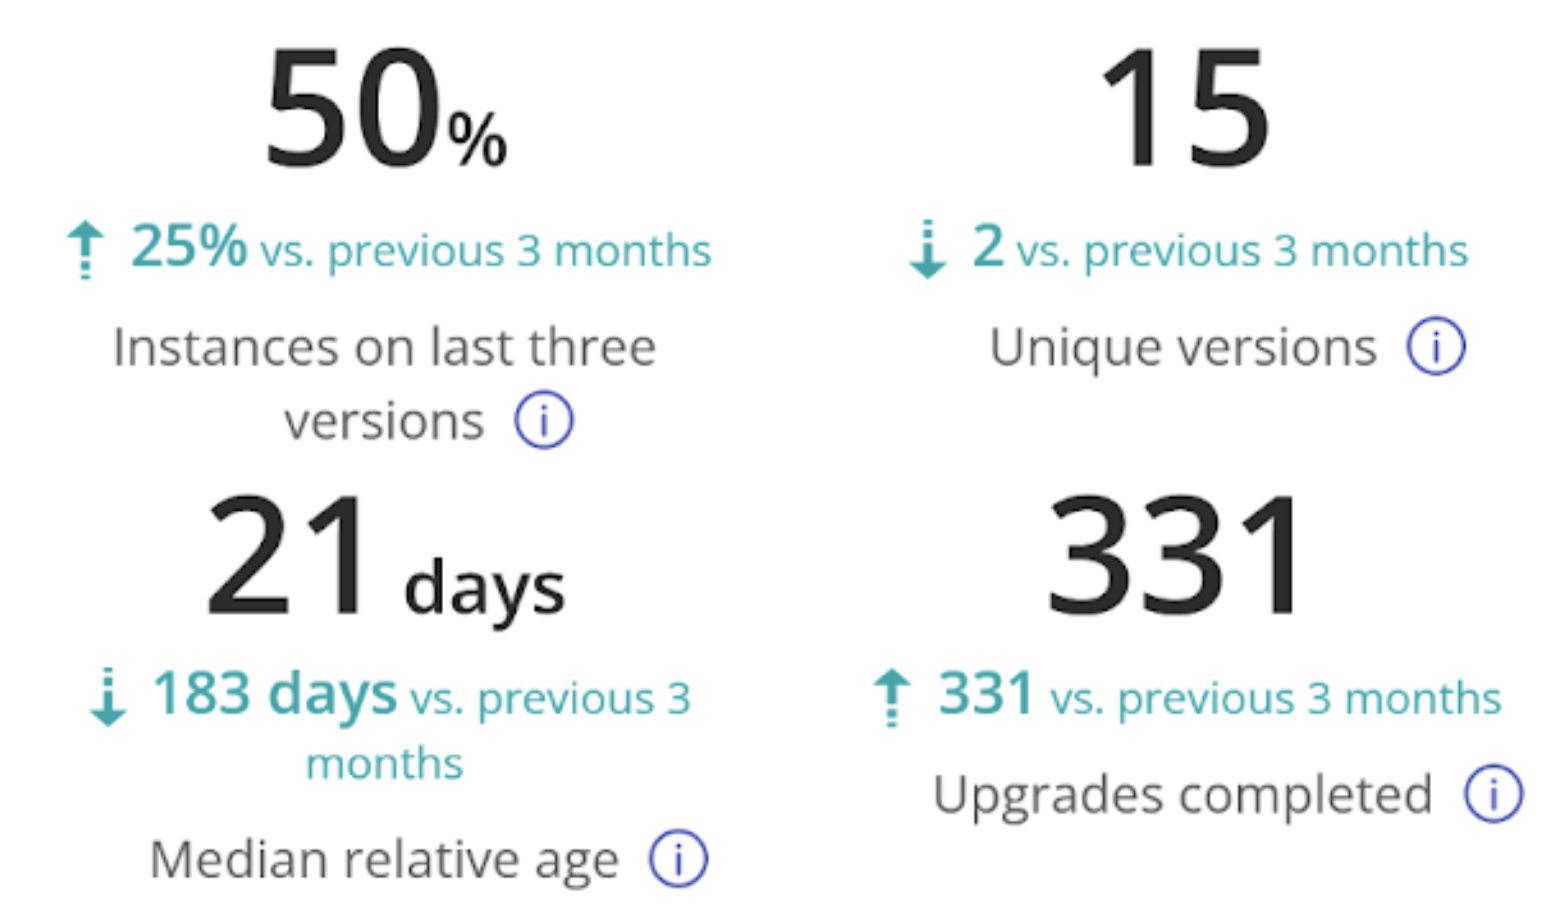
In addition to the graph, you’ll see four key metrics for tracking adoption performance.
Adoption Rate - % Instances on Last Three Versions
Directly inspired by Making Software Distribution a Core Organizational Competency, this number shows the % of users on the last three released versions of software.

This is primarily designed for high-performing teams that release a new on-prem version every 4-6 weeks. If you release very frequently (or very infrequently), you may find Median Age of Deployed Software to be a more interesting metric to track.
Unique Deployed Versions
This is a measure of the number of versions of your software that are running out in the field. Keeping this number low can drive efficiency by reducing the number of versions for which your team needs to maintain documentation and support guides.

Median Age of Deployed Software
The median age of your deployed software is computed by taking all running instances of your software, ordering them by age, and computing the age of the release. Rather than measuring the absolute age (total days since that release was published), this is almost always more useful as relative age (age compared to latest available release). While there are pros/cons for both, there are a lot of reasons to prefer relative age, including the fact that absolute age will naturally increase in between releases, before dropping suddenly when a new release is made. This can generate a lot of noise in the data compared to relative age.

Upgrades Completed
Total number of upgrades completed is more of a “raw” metric, but we’ve included it to give you a simple visual indicator of whether your customers are upgrading more in a given time period or less. Getting technical, this is computed by counting the number of unique versions an instance was running during a given time period, and subtracting 1 from that number.
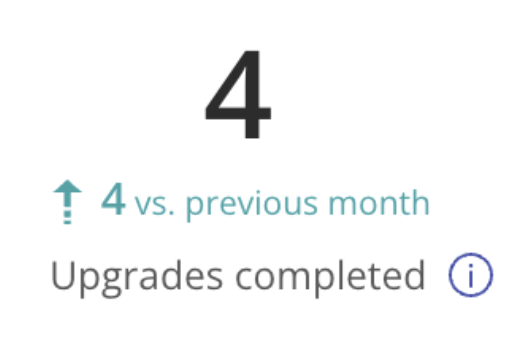
If your business is growing and you’re looking at large enough time periods (3+ months), you should almost always expect the number of upgrades in a time period to be increasing relative to a previous interval of the same size.
Filters and Segmentation
Because a release version can have a different age / sense on different channels, these reports are currently available at a channel-level rather than application-level. There are a number of other toggles that can allow you to filter data by:
- License Type
- Reporting Period
- Channel
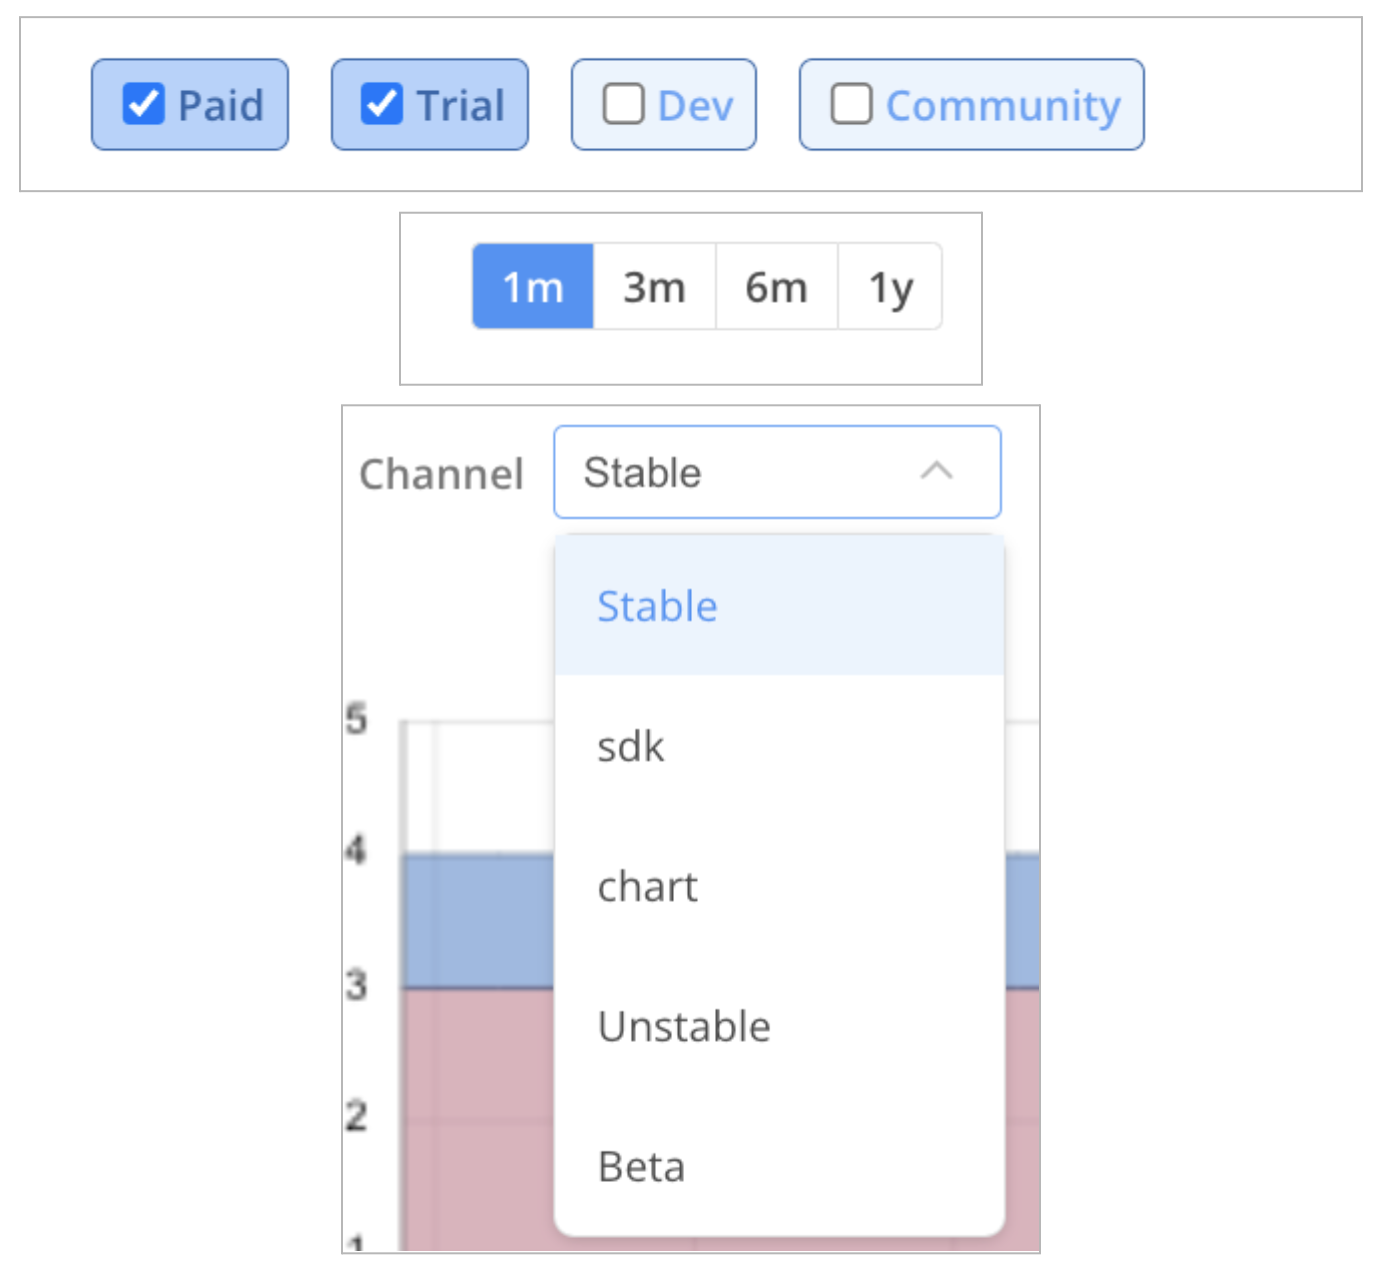
It’s worth noting that while this feature is in beta, the controls for the report will not affect the customers list displayed. You can still search/filter the customers list with the existing controls:

Status
We’re happy to announce that this report is now in Beta and we’re actively seeking feedback as we iterate on the experience, performance, and how we present this data. If you have thoughts or feedback, we’d love to hear from you.
What’s Next
- Stay tuned for our upcoming Deep Dive on Adoption Metrics
- Watch our Adoption + Security Webinar with our Andrew Storms, VP Security @ replicated, Ian Zink, Sr Developer Advocate @ replicated, and Lance Larson, Head of Solutions at Opal
- We’re continuing to iterate this report to GA. Again, if you have thoughts or feedback, we’d love to hear from you.
- We’re working to enable you to incorporate data from customers running in airgapped environments. If you’d like to be an early tester or design partner in this work, sign up now to learn more and join our waitlist.
- The full public roadmap for Instance Insights is always available on Trello. General thoughts or feedback? Want to vote for a particular problem space or feature? Drop us a note.